Figures & data
Table 1 Baseline Information
Figure 1 Study flowchart.
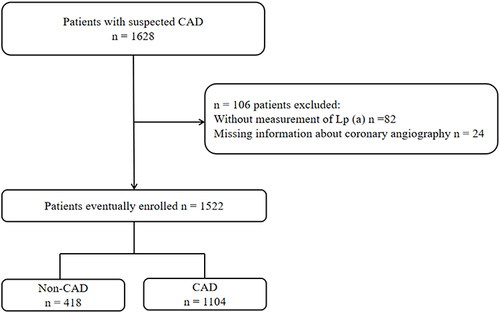
Table 2 Odds Ratios (ORs [95% CIs]) of Lp(a) and CAD
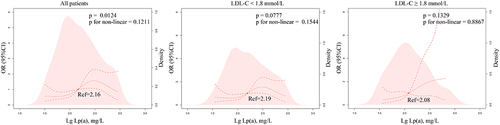
Figure 2 Association of Lp(a) with CAD in all patients and subgroups of different LDL-C level. Odds ratios and 95% CIs derived from restricted cubic spline regression, with knots placed at the 5th, 35th, 65th, and 95th percentiles of the distribution of Lg Lp(a). The reference point for Lg Lp(a) is located at OR=1. Ref is an abbreviation for reference. The lowest 2.5% and highest 2.5% of participants are not shown in the figures for small sample sizes.
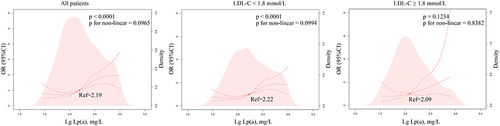
Figure 3 Association of Lp(a) with CAD in Non-T2DM patients and subgroups of different LDL-C level. Odds ratios and 95% CIs derived from restricted cubic spline regression, with knots placed at the 5th, 35th, 65th, and 95th percentiles of the distribution of Lg Lp(a). The reference point for Lg Lp(a) is located at OR=1. Ref is an abbreviation for reference. The lowest 2.5% and highest 2.5% of participants are not shown in the figures for small sample sizes.
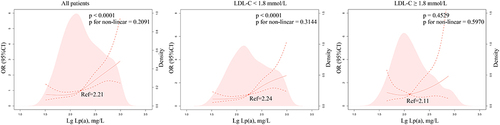
Figure 4 Association of Lp(a) with CAD in T2DM patient and subgroups of different LDL-C level. Odds ratios and 95% CIs derived from restricted cubic spline regression, with knots placed at the 5th, 35th, 65th, and 95th percentiles of the distribution of Lg Lp(a). The reference point for Lg Lp(a) is located at OR=1. Ref is an abbreviation for reference. The lowest 2.5% and highest 2.5% of participants are not shown in the figures for small sample sizes.