Figures & data
Figure 1 Continued.
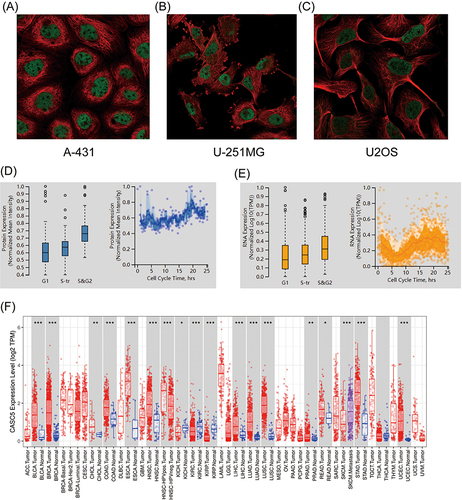
Figure 1 Continued.
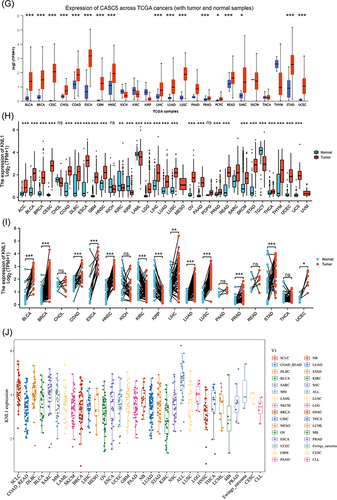
Figure 1 High mRNA expression level of KNL1 in pan-cancer. (A–C) KNL1 was mainly located in the nucleoplasm in A-431, U-251MG, and U2OS human cell lines. (D) Protein expression of KNL1 across cell cycle from the HPA database. Protein expression in individual U2Os cells, as determined from the fluorescence intensity of the protein of interest, is plotted along a linear representation of cell cycle pseudotime, as determined from the fluorescence intensities of the cell cycle markers. (E) RNA expression of KNL1 across cell cycle from the HPA database. Single-cell RNA sequencing of U2OS cell lines determines RNA expression levels and cell cycle in single cells. Normalized RNA expression in single cells was plotted along a linear representation of cell cycle pseudotimes based on the fluorescence intensity of cell cycle markers. Expression levels of KNL1 in different types of cancer in the TIMER database (F), UALCAN (G), TCGA unpaired samples (H) and TCGA paired samples (I). (J) The CCLE database showed the mRNA expression of KNL1 in different cancer cell lines. (K) IHC of KNL1 in pan-cancer from the HPA database. The staining intensity of KNL1 was stronger in most tumors except kidney cancer. ns, p≥0.05; *p< 0.05; **p<0.01; ***p<0.001.
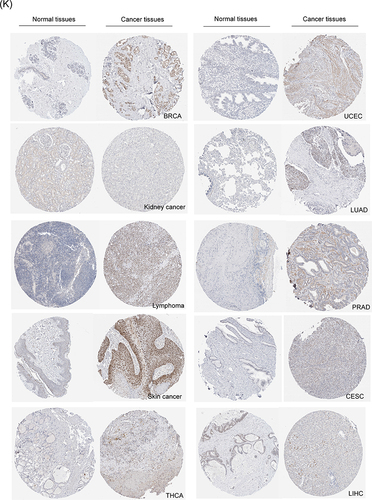
Figure 2 Continued.
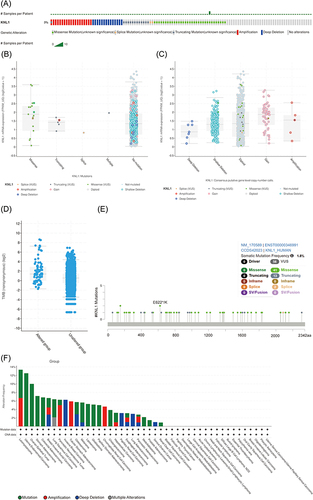
Figure 2 Gene alteration of KNL1 in pan-cancer. (A) The gene alteration profile of KNL1 in pan-cancer of 2922 samples. (B) The relation between mRNA expression levels and mutations in pan-cancer. (C) The relation between mRNA expression levels and consensus putative gene level copy-number calls in pan-cancer of 1210 samples. (D) The TMB of the KNL1 gene-altered group was higher than the unaltered group in pan-cancer. (E) Mutation sites of KNL1 and changes in amino acids. Different changes are shown on the gene’s domain structure as lollipops. How many changes are found at an amino acid is shown by the height of the lollipop. (F) Frequency of alteration of KNL1 in the detailed cancer types. (G) The promoter methylation level of KNL1 in 10 cancers with a significant statistical difference. The boxplot above represents the beta value for a CpG probe located 1500bp upstream of the gene start site. ns, p≥0.05; *p< 0.05; **p<0.01; ***p<0.001.
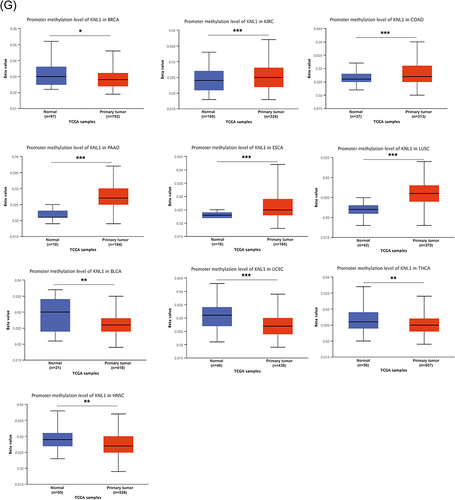
Figure 3 Continued.
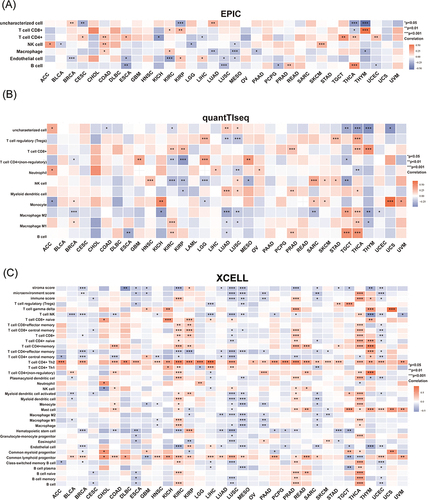
Figure 3 Continued.
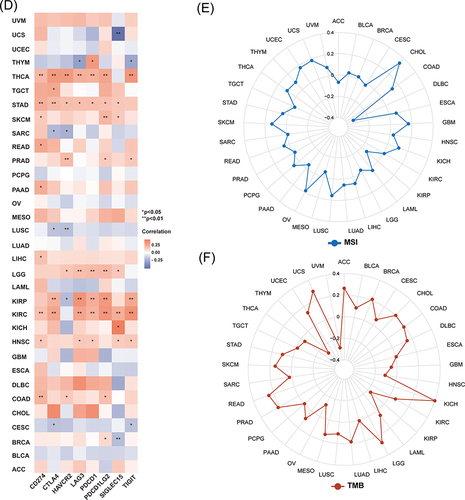
Figure 3 Unique tumor immune microenvironment associated with KNL1 in pan-cancer. (A-C) EPIC, quantTIseq, and XCELL algorithms were used to evaluate the correlation between the infiltration of different immune cells and high KNL1 expression. (D) KNL1 expression was positively related mostly to immune checkpoint related-genes. Correlation between KNL1 expression, MSI (E), and TMB (F). (G–J) TIDE scores of LUAD, STAD, THCA, and BRCA showing statistically significant differences in the KNL1-low group and the KNL1-high group. ns, p≥0.05; *p< 0.05; **p<0.01; ***p<0.001.
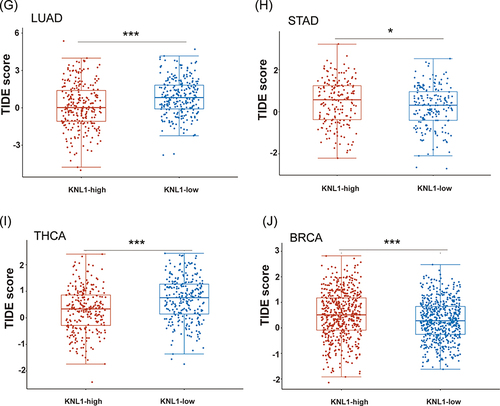
Figure 4 Prognostic values of KNL1 expression in pan-cancer. (A) Diagnostic ROC curves were used to predict the diagnostic value of KNL1 in pan-cancer. (B) Survival difference of OS between KNL1-low and KNL1-high in pan-cancer.
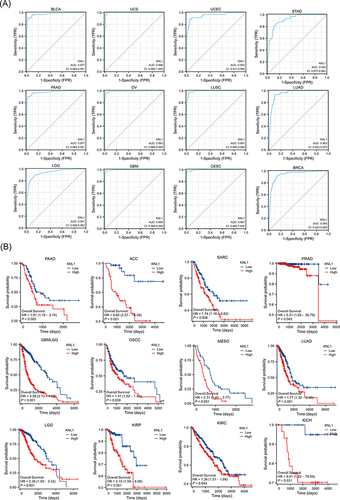
Figure 5 KNL1 and related DEGs in PAAD, STAD, and BLCA. Volcano Plot of DEGs between the KNL1-low group and the KNL1-high group in PAAD (A), STAD (B), and BLCA (C). The interaction network of the 10 hub genes most associated with KNL1 in PAAD (D), STAD (E), and BLCA (F).
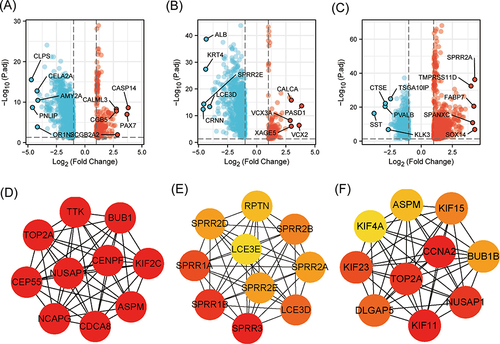
Figure 6 The function enrichment analysis of related DEGs of KNL1 in PAAD, STAD, and BLCA. GO and KEGG enrichment analysis of related DEGs of KNL1 in biological functions (BP), cellular components (CC), molecular functions (MF), and signal pathways in PAAD (A), BLCA (B), and STAD (C). (G-I) Ridge plots of the most significantly enriched pathways between KNL1-low and KNL1-high using GSEA analysis in PAAD (D), STAD (E), and BLCA (F). The Y-axis is the name of the gene set, and the X-axis is the distribution of the values of the genes of core_enrichment in the corresponding gene set. GeneRatio: Ratio of the number of genes enriched in the pathway to the number of KNL1-related genes; Counts: Number of genes included in the pathway.
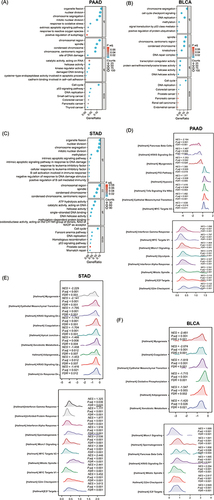
Figure 7 Continued.
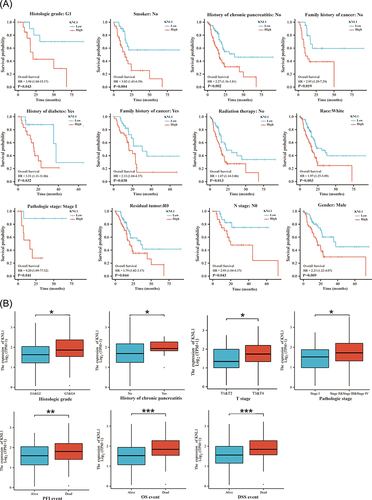
Figure 7 Prognostic values of KNL1 and prognostic nomogram model in PAAD. (A) Survival difference of OS between KNL1-low and KNL1-high in PAAD. (B) The expression difference of KNL1 in different clinicopathological subgroups. (C and D) Forest map based on univariate and multivariate Cox analyses for overall survival. (E) A nomogram for predicting 1-, 2-, and 3-year OS survival of PAAD. (F) The calibration curve for the 1-, 2-, and 3-year OS survival nomogram. (G) The DCA curve for the prognostic model. ns, p≥0.05; *p< 0.05; **p<0.01; ***p<0.001.
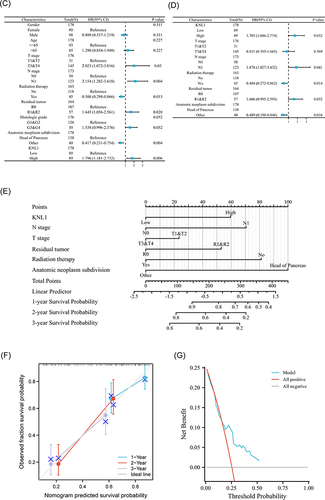
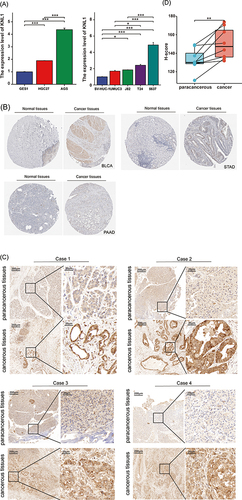
Figure 8 Validation of KNL1 expression in PAAD, STAD, and BLCA. (A) Real-time PCR was performed in gastric cancer, BLCA, and their corresponding normal tissue cell lines. (B) Stronger KNL1 IHC staining intensity was observed in cancer tissues in PAAD, STAD, and BLCA from the HPA database. (C) IHC staining of KNL1 in paracancerous and cancerous tissues of PAAD patients. (D) Matched samples t-test showed cancerous tissues had a higher H-score than paracancerous tissues, ns, p≥0.05; *p< 0.05; **p<0.01; ***p<0.001.