
Figures & data
Table 1 Survey and Focus Group Participants’ Characteristics (n = 59)
Figure 1 Burden of elimination care. The subparts (a–e) in the figure are indicators of quantifying the nurses’ EC burden. (* p<0.05).
Abbreviations: GW, General ward; ICU, Intensive care unit; INCW, Integrated nursing care ward; EC, Elimination care.
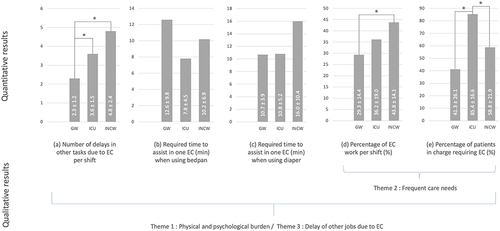
Table 2 Themes and Categories of Results from Qualitative Analysis