
Figures & data
Table 1 Characteristics of Critically Ill Patients Categorized by One-Year Mortality
Figure 1 Flowchart of subject enrollment.
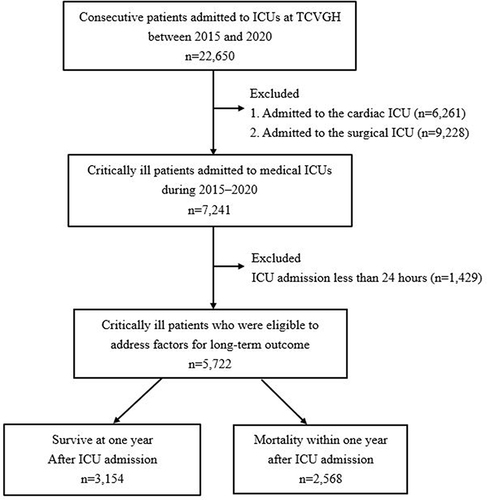
Table 2 Cox Proportional Hazard Regression Analysis for Long-Term Mortality Among the 5722 Critically Ill Patients
Table 3 Stratified Analyses of Modification Effect on the Association Between the Absolute Lymphocyte Count Cut by 1500 Counts/μL and Risk of Mortality
Table 4 Cox Proportional Hazard Regressions for Estimation of the Association Between the Level of Week-One Absolute Lymphocyte Count and Long-Term All-Cause Mortality in Distinct Patient Populations
Figure 2 Flowchart of propensity score matching.
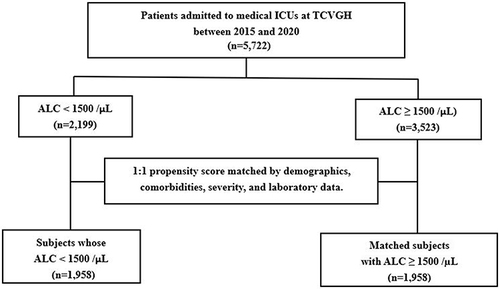
Figure 3 The strength of association between long-term mortality and week-one absolute lymphocyte count with distinct cut-off values. (A) Original population. (B) Propensity-score matched population.
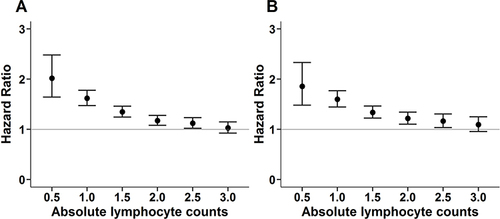
Table 5 Association Between Absolute Lymphocyte Count Lower Than 1500 per μL and Long-Term Mortality in Critically Ill Patients After Excluding Those Who Died Within Particular Durations