Figures & data
Table 1 Patients’ Characteristics of Training Set and Validation Set
Figure 1 The flowchart of the training and validating process for clinical-radiomics nomogram modeling.
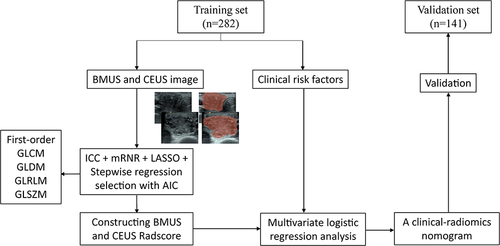
Figure 2 The method of choosing radiomics features from the training set using the LASSO algorithm. (A and C) show the LASSO coefficient profiles for the BMUS and CEUS features, respectively. In (B and D), it is shown how to apply minimal criteria analysis and 10-fold cross-validation to get the ideal penalization coefficient lambda () for the BMUS and CEUS LASSO models, respectively. The lambda values chosen based on the minimal criterion and one standard error of the minimum criteria are shown as dotted vertical lines.
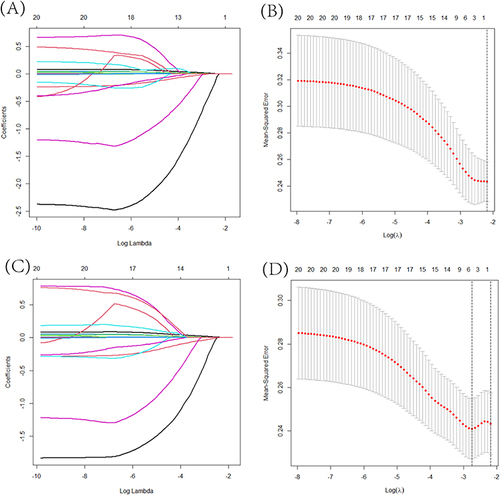
Table 2 The Results of Stepwise Multivariate Analyses for Prediction of LNM
Figure 3 The ROC curves of the clinical model and clinical-radiomics model in the training set (A) and validation set (B).
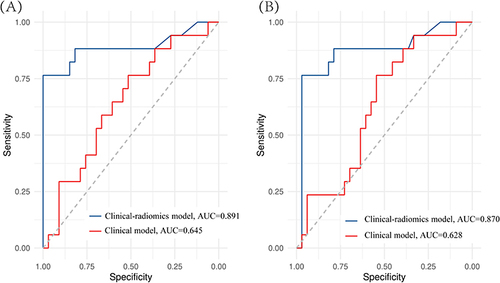
Figure 4 A radiomic nomogram for evaluating cervical LNM based on the clinical-radiomics model (A). Clinical-radiomics nomogram calibration curves in the training set (B) and validation set (C).
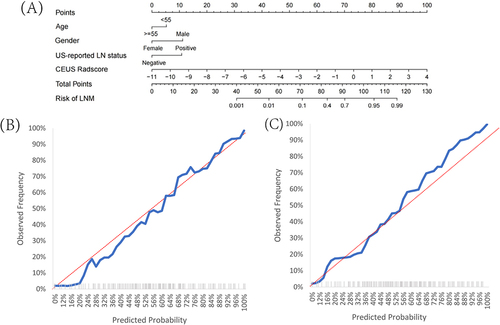
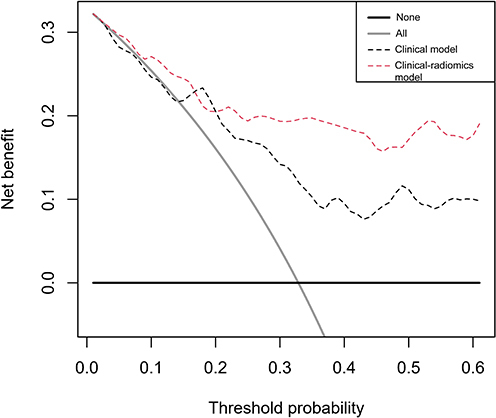
Figure 5 Decision curve of clinical model and clinical-radiomics model. The decision curve analysis (DCA) measures the net benefit (y-axis) versus the model’s high-risk threshold (x-axis) for different models.