
Figures & data
Table 1 Clinical Features of the Participants
Table 2 Univariable and Multivariate Analysis of Variables Associated with CKD Risk
Figure 1 The nomogram developed in this study to calculate the predicted 3-year CKD risk.
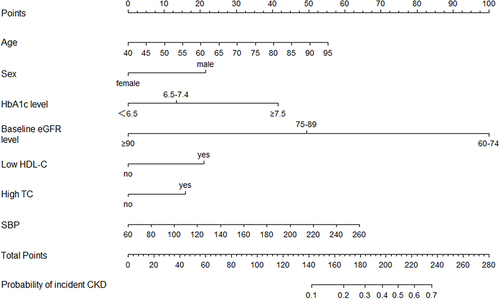
Figure 2 A case of using the nomogram to calculate the predicted 3-year CKD risk.
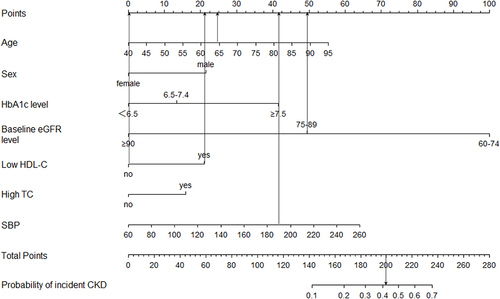
Figure 3 Receiver operating characteristic curve (ROC) for predicting the 3-year risk of CKD. AUCs (areas under the curve) with 95% confidence intervals (red area) were calculated by 1000 bootstrap resamples.
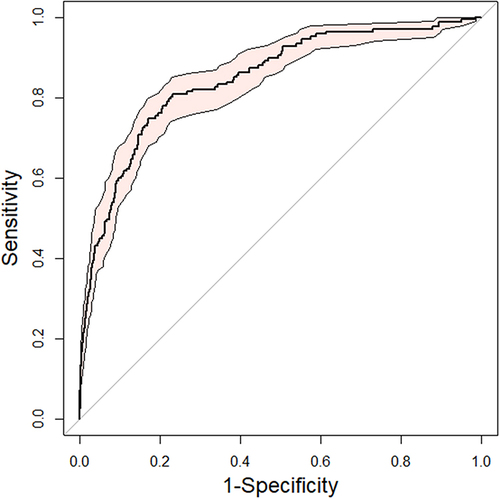
Figure 4 Calibration plots for observed and predicted 3-year risks of CKD. The black dashed line indicates the reference line that represents where a perfect calibration would lie, the solid red line indicates the result for our risk prediction model, and the solid green line indicates optimism-corrected calibration plots derived from 1000 bootstrap resamples.
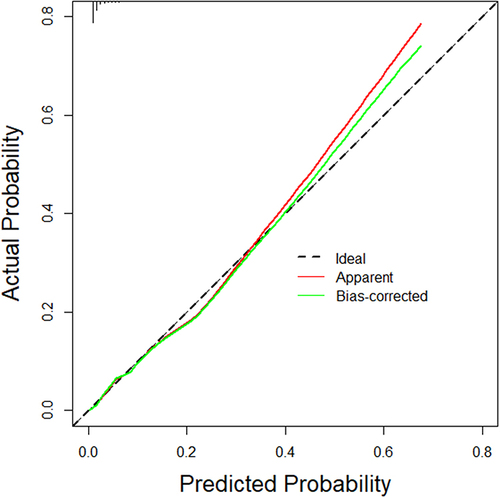
Table 3 Values of Sensitivity, Specificity, PPV and NPV for the Nomogram Scores at Different Cut-off Values