Figures & data
Figure 1 Expression and prognostic value of TALDO1 in HCC. (A) TALDO1 gene expression differences in HCC tissues and adjacent non-tumor tissues in the TCGA database and GEO database; (B) The landscape of TALDO1‐related clinicopathological features of HCC in TCGA database; (C) The correlation between TALDO1 mRNA expression and clinicopathological features; (D) Univariate and multivariate Cox regression analyses of overall survival in HCC patients; (E) Kaplan‐Meier analysis of TALDO1 expression in TCGA.
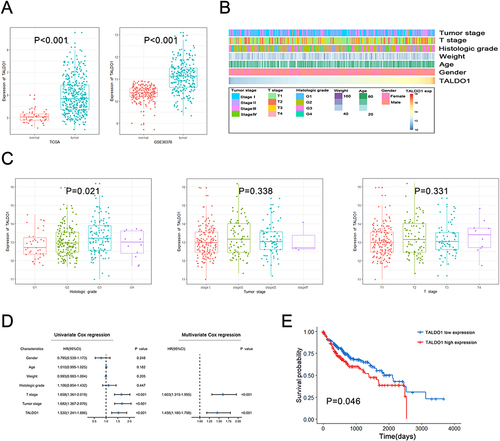
Figure 2 Establishing nomogram for predicting prognosis of OS for HCC patients. (A) Nomogram for predicting 1-, 3-, and 5-year OS for HCC patients in TCGA; (B) 1-, 3-, and 5-year calibration plots of the established nomogram; (C) 1-, 3-, and 5-year ROC curves of the established nomogram. (***P < 0.001).
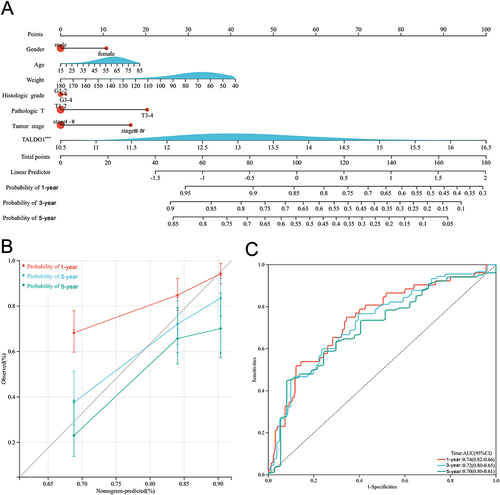
Figure 3 Functional enrichment and immune infiltration analysis in HCC. (A) Biological processes (BP), cellular components (CC), molecular functions (MF), and Kyoto Encyclopedia of Genes and Genomes (KEGG) pathway analysis of TALDO1 in TCGA database; (C and D) Correlation of TALDO1 expression with CD4+ T cell and regulatory T cell; (E and F) Correlation of TALDO1 expression with immunostimulators and immunoinhibitors.
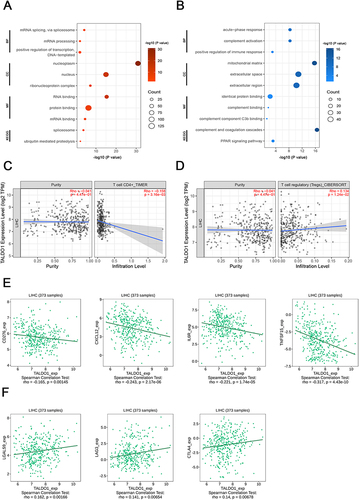
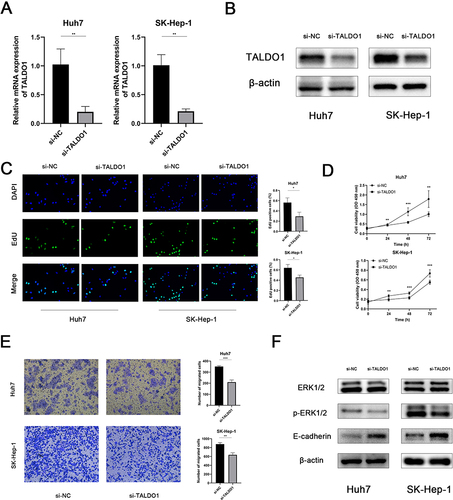
Figure 4 Knockdown of TALDO1 expression inhibits proliferation and migration through ERK/EMT pathway in the Huh7 and SK-Hep-1. (A and B) Validation of TALDO1 knockdown in Huh7 and SK-Hep-1 by PCR and Western blot; (C and D) CCK8 and EdU assays were performed to detect the proliferation of TALDO1 knockdown; (E) Cell migration abilities were determined by Transwell assay; (F) The expression levels of pathway-related proteins were detected by Western Blot. (*P < 0.05; **P < 0.01; ***P < 0.001).