Figures & data
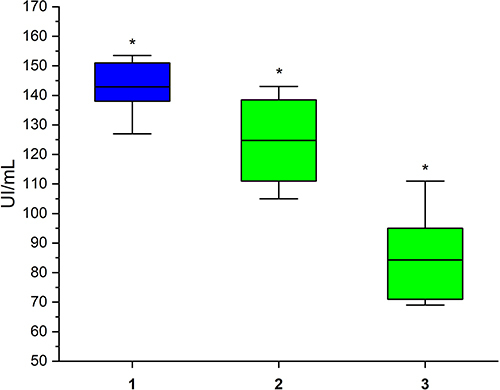
Figure 1 The activated partial thromboplastin time in donor groups with titer of anti-SARS-CoV-2 IgG in blood plasma, Index (S/C): 1–0; 2–75 ± 5; 3–85 ± 5. *p < 0.05; **p > 0.05.
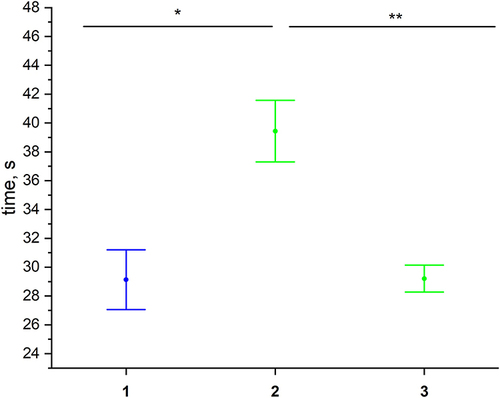
Figure 2 The thrombin time in donor groups with titer of anti-SARS-CoV-2 IgG in blood plasma, Index (S/C): 1–0; 2–10 ± 3; 3–65 ± 5. *p < 0.05; **p > 0.05.

Figure 3 The activity of ATIII in donor groups with titer of anti-SARS-CoV-2 IgG, Index (S/C): 1–0; 2–65 ± 5; 3–75 ± 5. *p < 0.05.
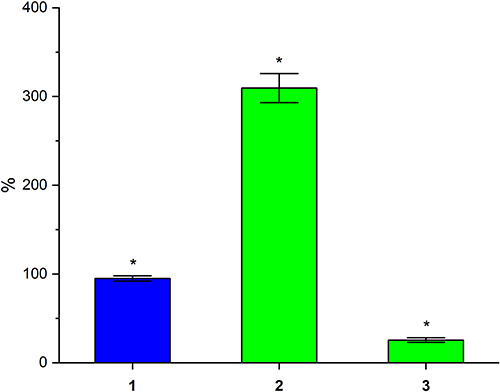
Figure 4 The concentration of ATIII in donor groups with titer of anti-SARS-CoV-2 IgG, Index (S/C): 1–0; 2–75 ± 5; 3–175 ± 5. *p < 0.05.
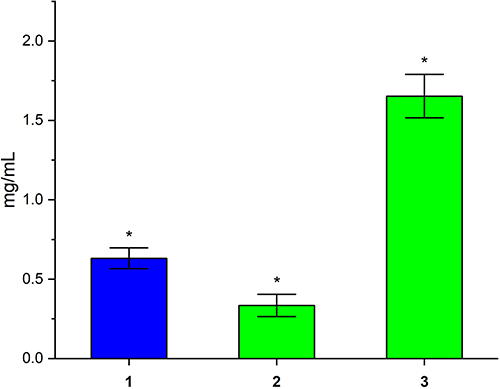
Figure 5 The PC activity in donor groups with titer of anti-SARS-CoV-2 IgG, Index (S/C): 1–0; 2–55 ± 5; 3–95 ± 5. *p < 0.05.
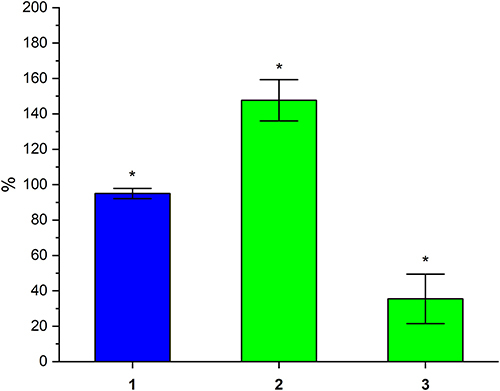
Figure 6 The concentration of PC in donor groups with titer of anti-SARS-CoV-2 IgG, Index (S/C): 1–0; 2–10 ± 3; 3–85 ± 5. *p < 0.05.
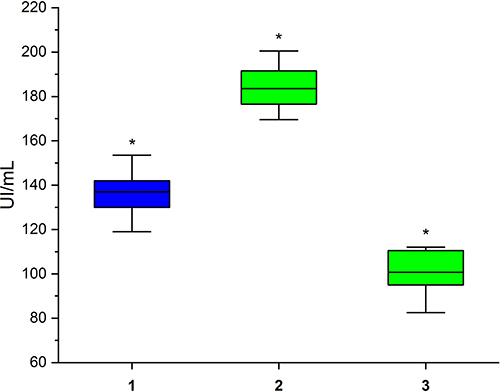
Figure 7 The concentration of thrombomodulin in donor groups with titer of anti-SARS-CoV-2 IgG, Index (S/C): 1–0; 2–10 ± 3; 3–75 ± 5. *p < 0.05.