Figures & data
Figure 1 The cross-section of the chest CT image at the 4th thoracic vertebra and the red marking area was the PMA.
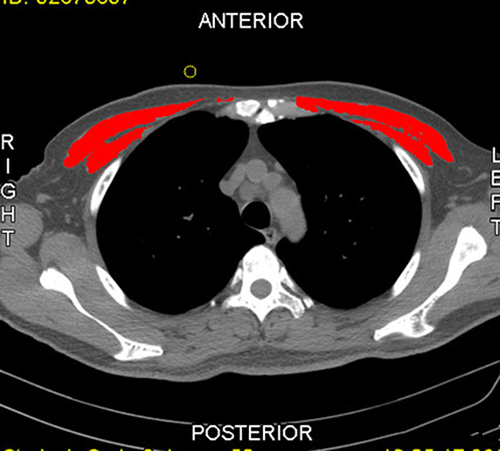
Table 1 Comparison of General Data Between COVID-19 Patients in the Survival and Death Groups
Table 2 Comparison of Pectoralis Muscle CT Value Between COVID-19 Patients in the Survival and Death Groups
Table 3 Comparison of Laboratory Parameters Between COVID-19 Patients in the Survival and Death Groups
Table 4 Analysis of the Risk Factors for the Death of COVID-19 Patients
Figure 2 Prognostic nomogram model of risk for death in patients with COVID-19.
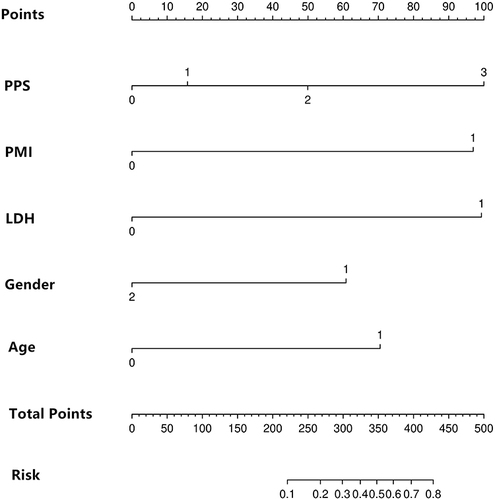
Figure 3 Consistency between the predicted mortality and actual observed results in COVID-19 patients was validated by the calibration curve.
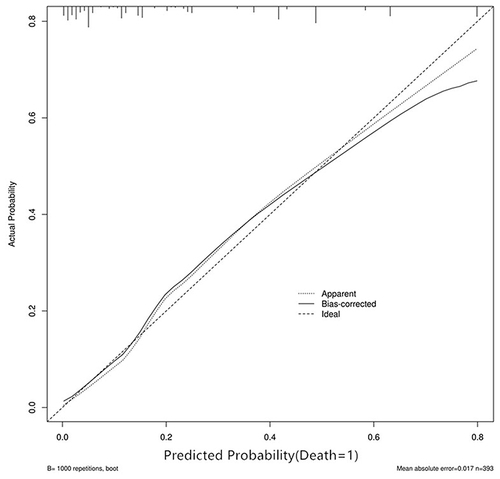
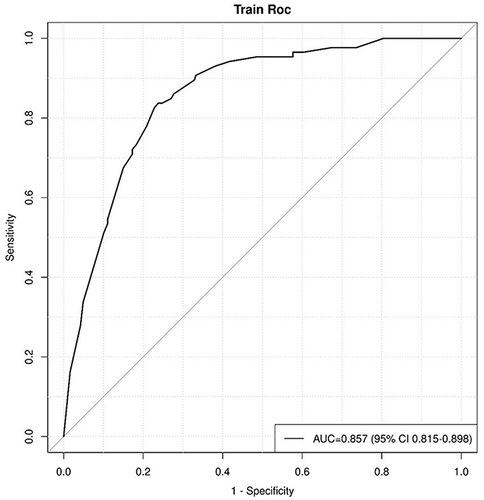
Figure 4 ROC curve of the prognostic nomogram model of risk for death in patients with COVID-19.