Figures & data
Figure 1 The flow chart of this study.
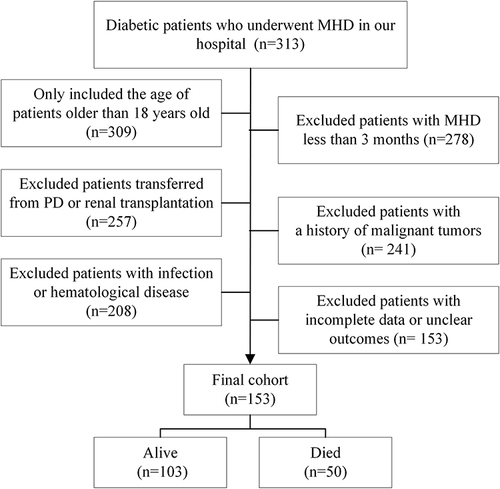
Table 1 The Baseline Characteristics of All Patients
Figure 2 X-tile analyses of SIRI to obtain the optimal cutoff value of SIRI. X-tile plots for patients with diabetic MHD are shown on the left panels; the black circles indicate the optimal cutoff values, which are also presented in histograms (middle panels). Kaplan-Meier curves are shown in the right panels.
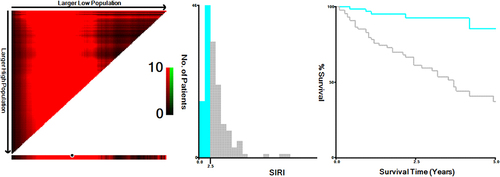
Figure 3 The waterfall plots and forest plots of the high-SIRI group and low-SIRI group for the prognosis of diabetic MHD patients. The waterfall plot of SIRI for each patient of mortality (A) and the subgroup analysis of the SIRI for the prognosis of individuals with diabetic MHD patients (B).
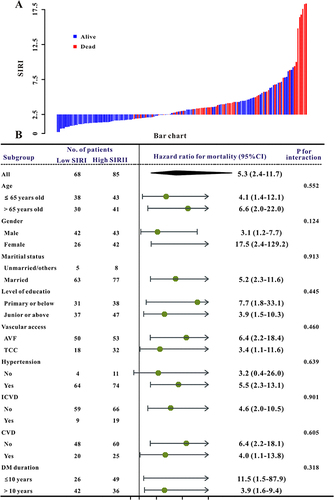
Figure 4 The SIRI was established to detect the overall mortality of patients with diabetic MHD. All patients were distinguished into high and low risk based on the SIRI (A), the relationship between survival time and prognosis of patients in the two corresponding groups (B), and the heatmap of other markers between the two groups (C). Receiver operating characteristic (ROC) curve analysis of the SIRI for overall mortality (D), Decision curve analysis of the risk score for the overall mortality (E). Kaplan-Meier curves show the overall mortality of groups with different risks (F).
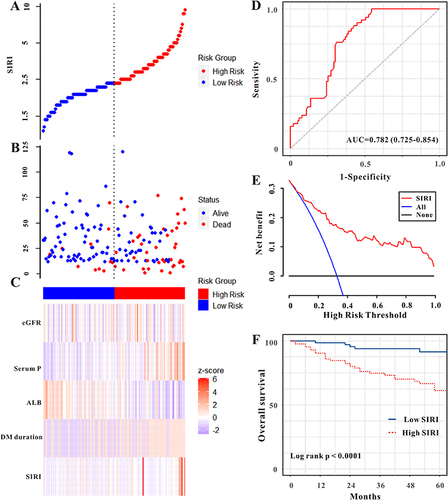
Table 2 Univariate and Multivariate Cox Regression Analysis for All-Cause Mortality
Figure 5 Selection of significant factors associated with OS in diabetic MHD patients by LASSO Cox regression model. (A) The selection process of the optimum value of the parameter λ in the Lasso regression model by cross-validation method; (B) the variation characteristics of the coefficient of variables.
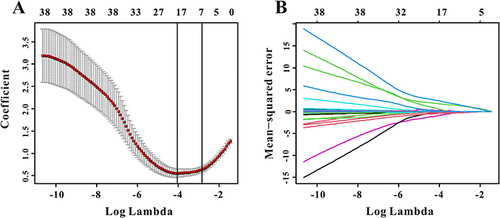
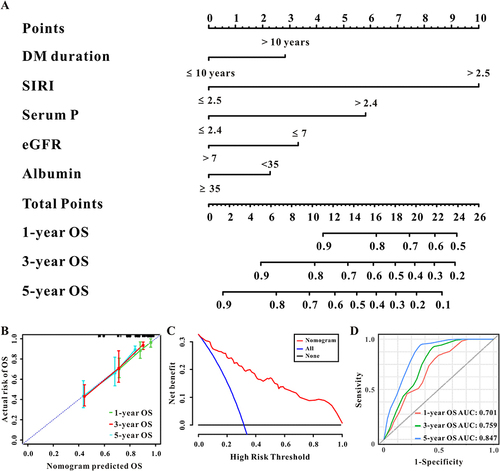
Figure 6 The established nomogram for OS in patients with diabetic MHD (A), the 1-year, 3-year, and 5-year calibration curves of the nomogram for OS (B), decision curve analysis of the nomogram for OS (C), and the time-dependent ROC curves for the 1-year, 3-year, and 5-year OS in patients with diabetic MHD (D).