
Figures & data
Figure 1 The flowchart illustrating the main steps of our study.
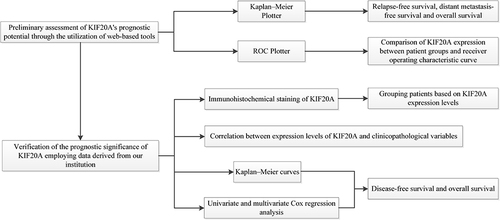
Figure 2 Kaplan-Meier curves illustrating the RFS (A), DMFS (B), and OS (C) of ER-positive BC patients receiving TAM therapy, stratified by KIF20A expression levels using the Kaplan-Meier Plotter (P < 0.001, P < 0.001, and P = 0.008, respectively, log rank test).
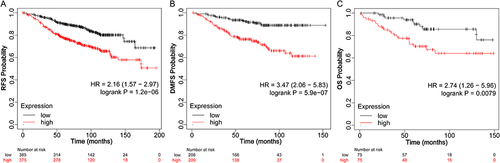
Figure 3 Predictive value of KIF20A in assessing the treatment outcome of TAM in ER-positive BC patients, evaluated using the ROC Plotter. (A) The comparison of KIF20A gene expression between patients with ER-positive BC who responded and did not respond to TAM therapy (P < 0.001, Mann–Whitney test). (B) The ROC curve depicting the predictive value of KIF20A expression for TAM treatment outcome in patients with ER-positive BC receiving TAM therapy (AUC = 0.63, P < 0.001).
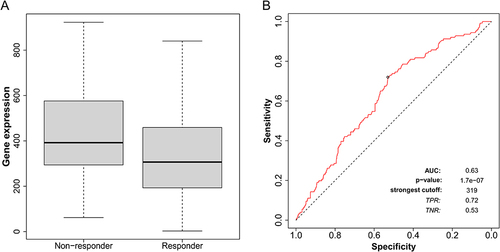
Table 1 Relationship Between KIF20A Expression and Clinicopathological Features in Patients with ER-Positive BC
Figure 4 IHC analysis of KIF20A expression in tumor tissues of ER-positive BC patients. (A) Representative image showing low expression level of KIF20A (×200). (B) Representative image showing high expression level of KIF20A (×200).
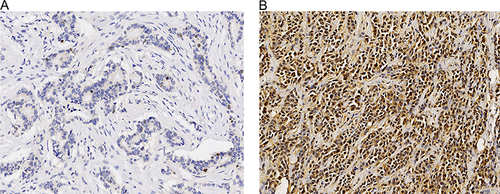
Figure 5 The Kaplan-Meier curve depicting the DFS of patients, stratified by KIF20A expression levels (P = 0.001, log rank test).
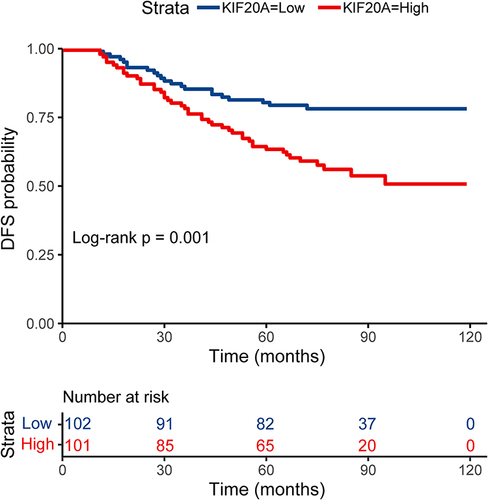
Figure 6 The Kaplan-Meier curve depicting the OS of patients, stratified by KIF20A expression levels (P = 0.002, log rank test).
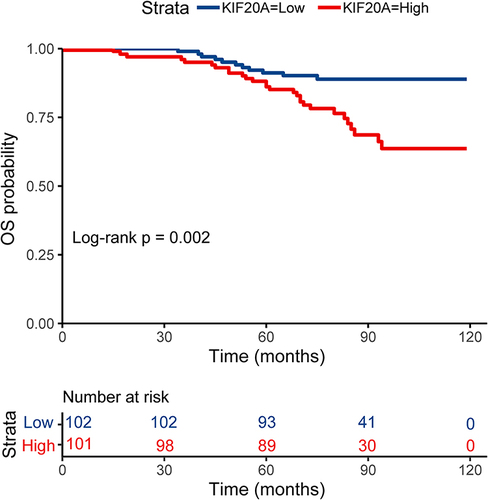
Table 2 Univariate and Multivariate Cox Analysis Results of Clinicopathological Variables and Expression Levels of KIF20A for DFS of ER-Positive BC Patients with TAM Therapy
Table 3 Univariate and Multivariate Cox Analysis Results of Clinicopathological Variables and Expression Levels of KIF20A for OS of ER-Positive BC Patients with TAM Therapy