Figures & data
Figure 1 This figure shows 6 different glenosphere eccentricities positions (concentricity, +2 mm inferior, +2 mm posterior, +2 mm anterior, +2 mm anteroinferior, and +2 mm posteroinferior) with no change in the baseplate.
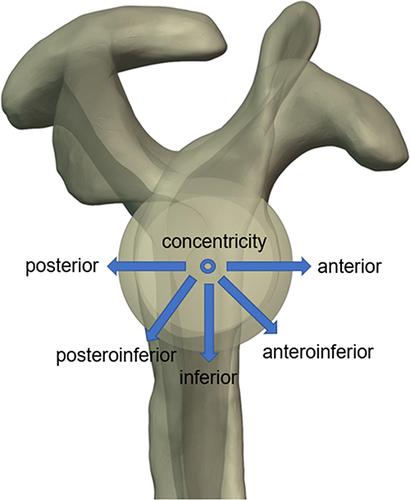
Figure 2 Shows the simulation of impingement in the shoulder joint after RSA during abduction and internal rotation.
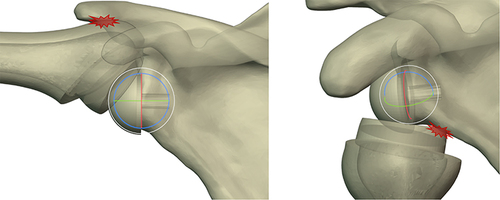
Figure 3 Shows the comparison of the abduction-adduction ROM for different glenosphere eccentricities under all glenoid options. Native: the native shoulder, T: tilt, and L: lateral offset.
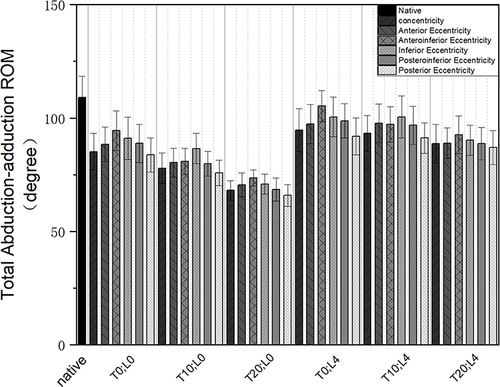
Figure 4 Shows the comparison of the flexion-extension ROM for different glenosphere eccentricities under all glenoid options. Native: the native shoulder, T: tilt, and L: lateral offset.
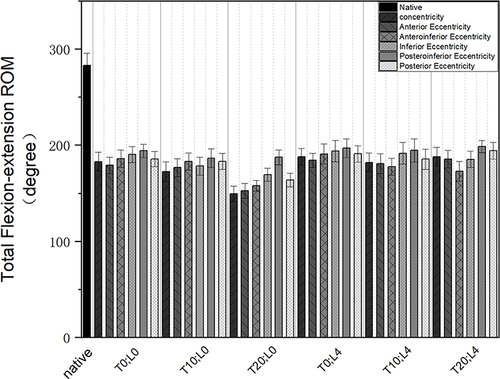
Figure 5 Shows the comparison of the internal-external rotation ROM for different glenosphere eccentricities under all glenoid options. Native: the native shoulder, T: tilt, and L: lateral offset.
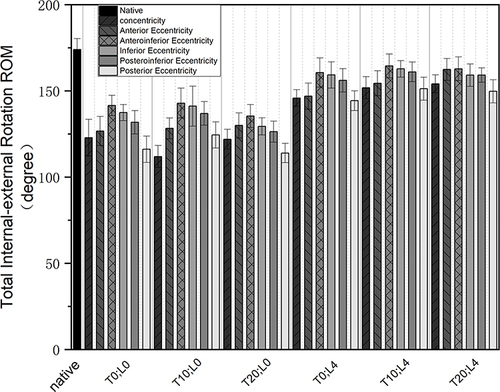
Figure 6 Shows the comparison of the Total global ROM for different glenosphere eccentricities under all glenoid options. Native: the native shoulder, T: tilt, and L: lateral offset.
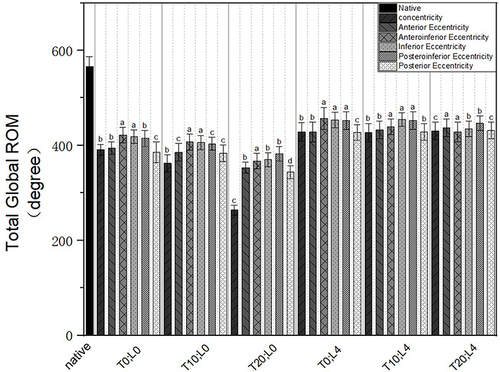
Figure 7 Graph presents a heatmap of the frequency of impingement locations for 6 different glenosphere eccentricities positions under different tilt and lateral offset combinations. Impingement type:1 represents impingement between bones and 2 represents impingement between bone and implant. In abduction, the frequency of impingement between the greater tuberosity and acromion; in adduction, the frequency of impingement between the scapular neck and poly; in flexion, the frequency of impingement between the lesser tuberosity and coracoid; in extension, the frequency of impingement between the humerus and scapular neck; in IR and ER, the frequency of impingement between the scapular neck and poly.
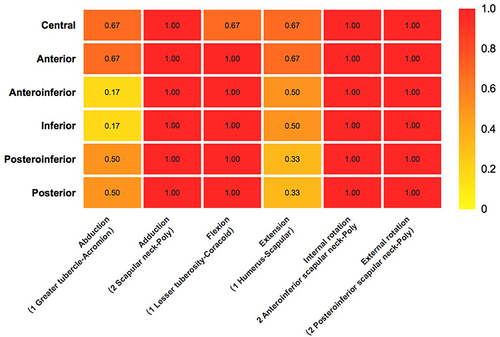
Table 1 Impingement Sites for Different Glenoid Options When the Glenosphere Anteroinferior Eccentricities
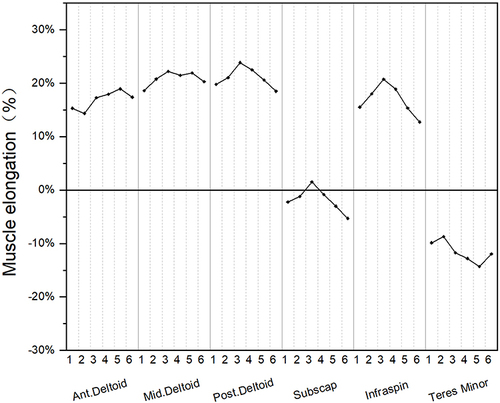
Figure 8 This figure shows the effect of 6 different glenosphere eccentricities on the length changes of the anterior, middle, and posterior bundles of the deltoid muscle and the rotator cuff muscles in the T0L4 combination. 1, 2, 3, 4, 5, and 6 represent concentricity, inferior, posterior, anterior, anteroinferior, and posteroinferior glenosphere eccentricities, respectively. A positive percentage indicates elongation of the muscle relative to the normal shoulder, whereas a negative percentage indicates shortening of the muscle relative to the normal shoulder.