
Figures & data
Figure 1 Schematic diagram of vascular stratification of OCTA.
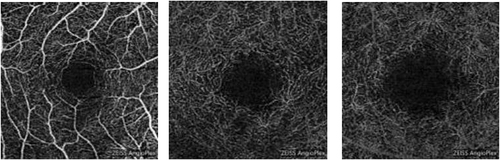
Table 1 Demographic and Clinical Data of PD Group and Control Group
Table 2 RNFL Thickness and Vascular Density Parameters in the Two Group
Figure 2 Comparison of RNFL thickness between the two groups. (A–C) Control group; (D–F): PD group; (A and D) RNFL thickness chart, blue and green indicate thinner areas, yellow and red indicate thicker areas; (B and E) RNFL thickness profile, the area marked by red lines is RNFL; (C and F) RNFL thickness line diagram.
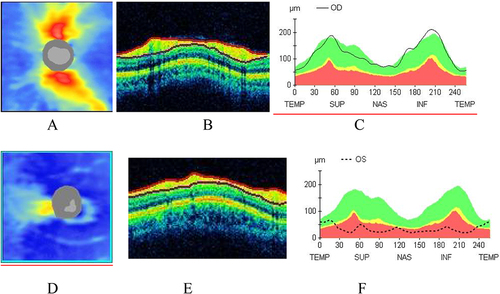
Figure 3 Comparison of vascular density between PD group and control group. (A and C) vessel length density; (B and D) vascular perfusion density; (A and B) control group; (C and D) PD group.
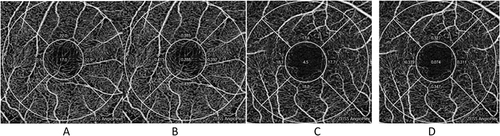
Figure 4 Comparison of RNFL thickness and vascular density between PD group and control group.
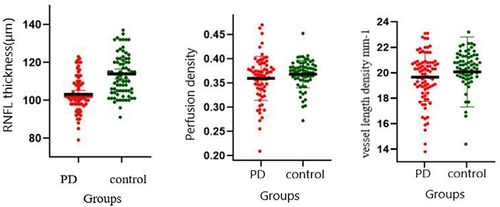
Table 3 Correlation Analysis Between RNFL Thickness Vascular Density and Disease Severity in PD Group
Table 4 Follow-Up RNFL Thickness and Vascular Density in Patients with Parkinson’s Disease