Figures & data
Figure 1 Flow diagram of the study design.
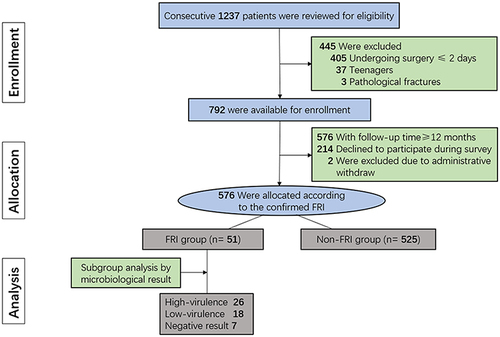
Table 1 Demographics and Clinical Characteristics of FRI and Non-FRI Patients
Table 2 Distribution Tests Regarding Serological Levels of the Inflammatory Biomarkers
Table 3 Comparison of Serum Inflammatory Biomarkers in the FRI/ Non-FRI
Table 4 Comparison of Serum Inflammatory Biomarkers in the High-/Low-virulence Groups
Figure 2 The violin plot shows the distribution of serum CRP and NLR levels in high-/low-virulence groups. The black line in the center indicates the median, the dashed lines above and below indicate the range of data, and the width of the violin indicates the density of data within that range.
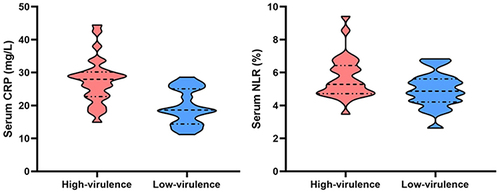
Table 5 The Diagnostic Value of Serum Biomarkers
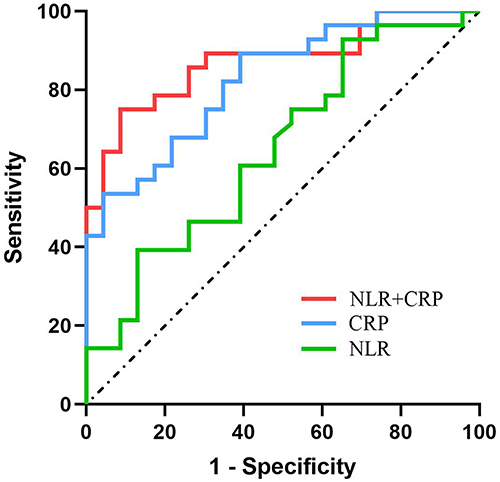
Figure 3 ROC of the CRP, NLR and CRP+NLR for high- /low-virulence FRI diagnosis.