Figures & data
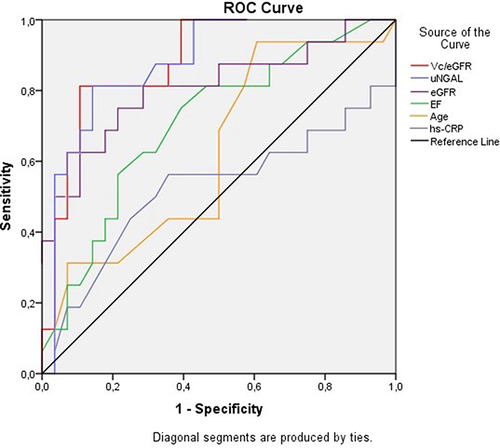
Figure 1 Study diagram.
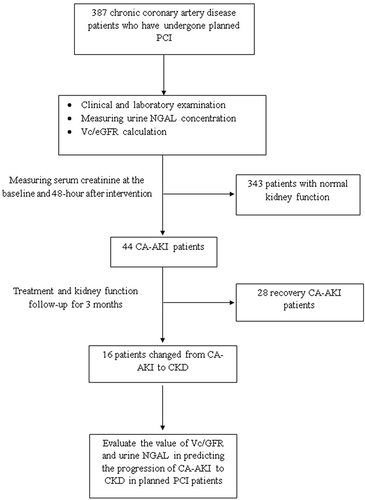
Table 1 Comparison of Demographic and Laboratory Characteristics in CA-AKI Group and Non-AKI One
Table 2 Comparing Demographic and Laboratory Characteristics in CA-AKI to CKD Group and Recovery One
Table 3 Multivariate Logistic Regression Analysis of Some Clinical Variables Related to the Progression of CA-AKI to CKD
Figure 2 Receiver-operating characteristic (ROC) curves of Age, CRP-hs, EF%, eGFR, Vc/eGFR and uNGAL for prediction of CA-AKI to CKD. Vc/eGFR ratio: AUC = 0.884; p < 0.001; cut-off value = 2.4; Sensitivity = 81.3%; Specificity = 89.3%; uNGAL: AUC = 0.878; p < 0.001; cut-off value = 58 ng/mL; Sensitivity = 81.3%; Specificity = 85.7%; eGFR: AUC = 0.808; p = 0.001; cut-off value = 63.08 mL/min/1.73m2; Sensitivity = 75%; Specificity = 78.6%; EF%: AUC = 0.709; p = 0.023; cut-off value = 64%; Sensitivity = 75%; Specificity = 60.7%).