
Figures & data
Figure 1 The flowchart of the study design and patient recruitment.
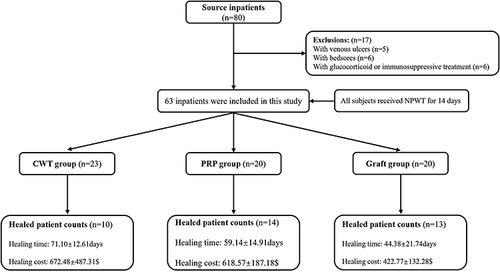
Figure 2 The clinical course of Negative Pressure Wound Therapy (NPWT) for DLEUs. (A) The cleaning and assessment of the wound. (B) The schematic representation of the NPWT initiation. (C) The schematic representation of the process of NPWT. (D) The schematic and device diagram of NPWT.
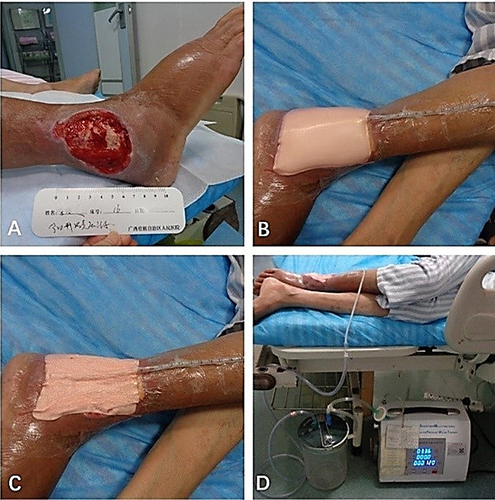
Figure 3 The dynamic process of platelet-rich plasma (PRP) treatment. (A) The cleaning and assessment of the wound. (B) The schematic representation of the PRP treatment. (C) The schematic representation of the wound closure process. (D) The wound was completely closure.
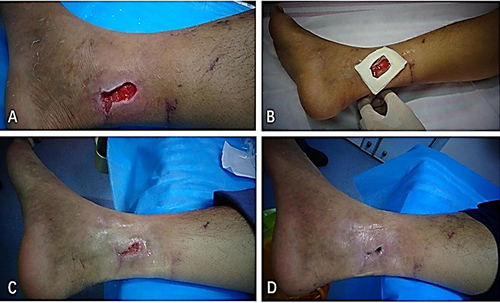
Figure 4 Skin extractor for the autologous wound edge dotted full-thickness skin grafting.
Figure 5 The dynamic process of the skin graft treatment. (A) The cleaning and assessment of the wound, and skin pieces were directly taken from the edge of the wound with the skin sampler and were spread relatively evenly on the wound surface. (B) The schematic representation of the negative pressure closed drainage of the wound. (C) The schematic representation of the wound healing process. (D) The schematic representation of the complete wound closure.

Table 1 Comparison of Baseline Clinical Characteristics Among the Three Groups
Table 2 Cox Regression Analyses for the Predictive Factor of Diabetic Foot Ulcers Healing
Table 3 Univariate and Multivariate Cox Regression Analysis for ABI- and TcPO2-Stratified Analyses
Figure 6 Kaplan-Meier curves of the cumulative incidence of unhealing wound among each group.
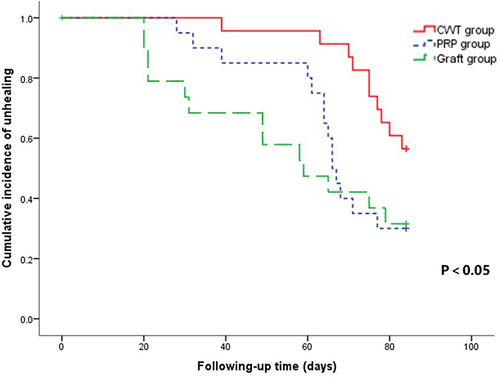
Table 4 The Comparison of the Wound Healing Speed Among Three Groups
Table 5 Comparison of Healing Time and Total Treatment Costs Among Three Groups
Data Sharing Statement
The original raw data used in this study is available from the corresponding author and can be provided upon reasonable request.