Figures & data
Table 1 Baseline Characteristics and Inflammatory Parameters of the Study Population
Figure 1 The violin plots demonstrating the differences in the distribution of the SIRI levels between Non-POD and POD groups.
Abbreviations: SIRI, systemic inflammation response index; POD, postoperative delirium.
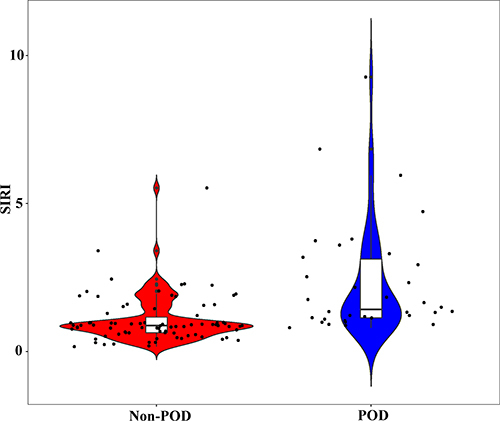
Table 2 Univariate and Multivariate Logistic Regression Analysis Showing the Independent Predictors of POD
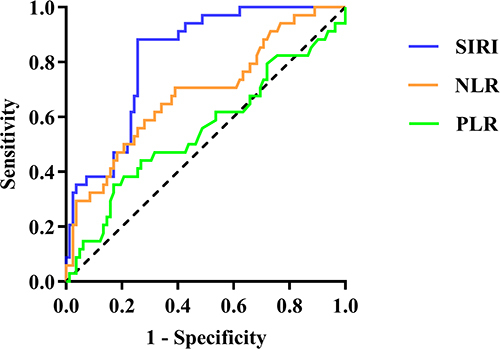
Figure 2 Receiver operating characteristic (ROC) curve for inflammatory parameters as a predictor of POD.
Abbreviations: SIRI, systemic inflammation response index; NLR, neutrophil-to-lymphocyte ratio; PLR, platelet-to-lymphocyte ratio.