Figures & data
Figure 1 The process of data collection, screening, grouping, and analysis.
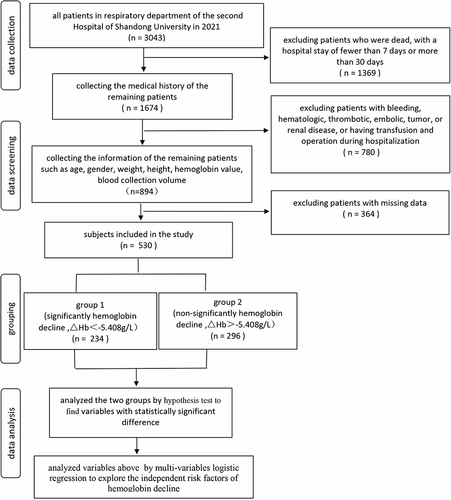
Table 1 Baseline Characteristics and Data of the Patients
Table 2 Multivariable Logistic Analysis to Determine Risk Factors of Δhb
Table 3 All Patients Were Grouped into Three Groups According to Hb at Admission, to Compare the Difference of Age, Gender, Blood Collection Volum, Δhb, Δplt Among the Three Groups
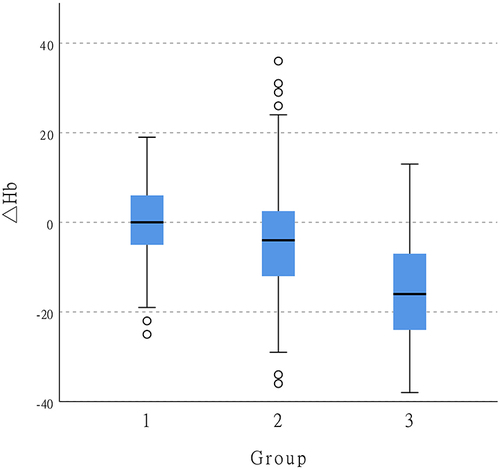
Figure 2 Grouping the patients based on hemoglobin value at admission to compare the difference of ΔHb among three groups. Group 1 referred to patients with anemia at admission, Group 2 referred to patients with normal hemoglobin values at admission, Group 3 referred to patients with high hemoglobin values at admission.