
Figures & data
Figure 1 Subjects’ inclusion flow chart.
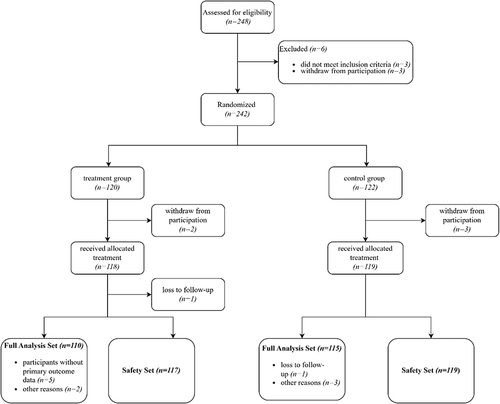
Table 1 Description of Baseline Parameters of Subjects in Two Groups (Full Analysis Set)
Table 2 Comparison of Changes in BE, Cl−, and Other Indicators at 15 Min After Colloid Infusion Between the Two Groups (Full Analysis Set)
Table 3 Comparison of Changes in the Concentrations of BE, Cl− and Other Indicators at 30 Min After Surgery Between the Two Groups (Full Analysis Set)
Table 4 Description of Adverse Events in Two Groups (Safety Set)
Table 5 Distribution of Different Grades of Adverse Events in Two Groups (Safety Set)
Table 6 Comparison of the Incidence of Adverse Events in Two Groups (Safety Set)