Figures & data
Table 1 Clinical characteristics of all samples (n = 54)
Figure 1 Superimposition of a DTT image of the left ATR on a sagittal T1-weighted image in HC. (A) INCLUDE-ROI I was set in the coronal plane passing the anterior commissure, and INCLUDE-ROI 2 was set in the coronal section passing the center of the genu of the corpus callosum. The ATR passing both ROIs is depicted with the corticospinal and corticopontine tracts. (B) The corticospinal and corticopontine tracts in this region were excluded by setting EXCLUDE-ROI 3 in the cross sectional plane passing the midbrain, resulting in the depiction of pure ATR.
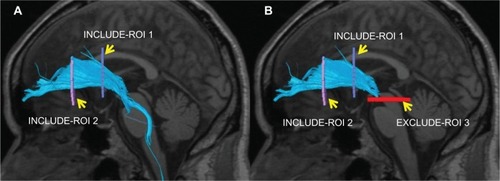
Figure 2 Nerve fascicles superimposed on T1-weighted sagittal images in HCs. (A) Anterior thalamic radiation; (B) cingulate fasciculus; (C) superior longitudinal fasciculus; (D) inferior longitudinal fasciculus; (E) uncinate fasciculus; (F) inferior fronto-occipital fasciculus; (G) fornix.
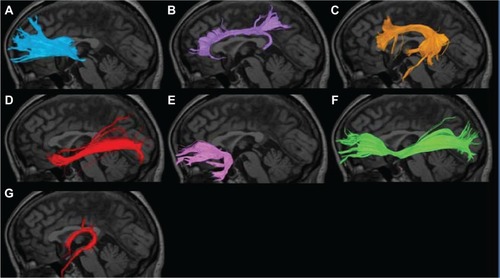
Figure 3 An example of poor depiction of the nerve fascicles superimposed on T1-weighted sagittal images. (A) Anterior thalamic radiation. Only a few nerve fascicles were depicted in the region beyond the genu of the corpus callosum (arrow). (B) Cingulate fasciculus. No nerve fascicle was depicted in the anterior upper region of the corpus callosum (arrow). (C) Superior longitudinal fasciculus. The region from the parietal to temporal lobe was not depicted (arrow). (D) Inferior longitudinal fasciculus. Only a few nerve fascicles were depicted (arrow). (E) Uncinate fasciculus. The nerve fascicle extending to the orbitofrontal cortex was not depicted (arrow). (F) Inferior fronto-occipital fasciculus. Very few nerve fascicles were noted, and no nerve fiber extending to the prefrontal area was depicted (arrow). (G) Fornix. The crus was not depicted (arrow).
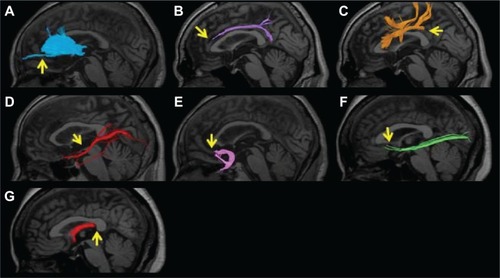
Table 2 Number of samples with poor depiction of nerve fascicles
Table 3 FA values of the nerve fascicles (means ± SD)
Table 4 ADC values of the nerve fascicles (means ± SD [× 10−3 mm2/s])
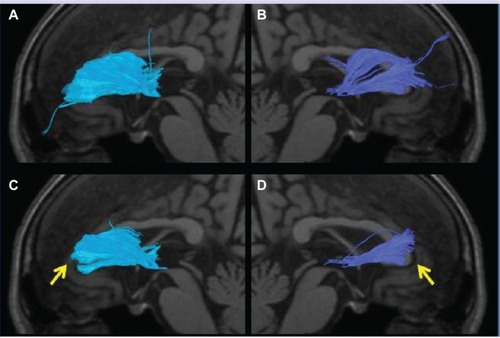
Figure 4 The anterior thalamic radiation superimposed on a T1-weighted sagittal image in an AD patient. (A) No left radiation passing the genu of the corpus callosum and extending into the prefrontal area was depicted (arrow). (B) Only a few nerve fascicles of the right radiation were observed, and depiction was poor (arrow). (C) The left posterior limb of the fornix was not depicted (arrow). (D) The right posterior limb of the fornix was only partially depicted.

Table 5 Number of AD cases with poor ATR depiction and their FA and ADC values by MMSE score
Figure 5 The anterior thalamic radiation superimposed on a T1-weighted sagittal image in an AD patient. (A and B) Several radiations passing the bilateral genus of the corpus callosum and extending to the prefrontal area are observed. (C and D) The radiations passing the bilateral genus of the corpus callosum and extending to the prefrontal area were lost by setting the threshold of the FA value at 0.24, and depiction can be readily judged as poor (arrow).