Figures & data
Table 1 Subject Characteristics for Identifying the Platelet Proteomics
Table 2 Subject Characteristics for Identifying the Platelet HMGB2 Level
Table 3 Subject Characteristics for Identifying the Plasma HMGB2 Level
Figure 1 Identification and verification of differently expressed proteins. (A) Volcano plot of differently expressed proteins between the two groups. The red plots represent upregulated proteins, and the green plots represent downregulated proteins. (B) The expression level of HMGB2 in platelet from STEMI patients and healthy controls. (C) The serum concentration of HMGB2 in STEMI patients and healthy controls. ****P < 0.0001 vs the NC group.
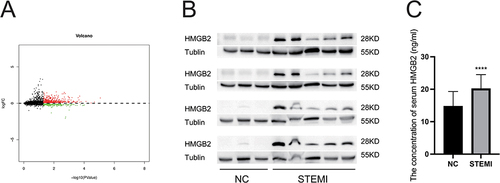
Figure 2 Correlation analysis of serum concentration of HMGB2 with blood cell counts. (A) The serum concentration of HMGB2 was positively related to neutrophil count and (D) leucocyte count. (B) The serum concentration of HMGB2 was not correlated with platelet count, (C) Monocyte count, (E) erythrocyte count, and (F) lymphocyte count.
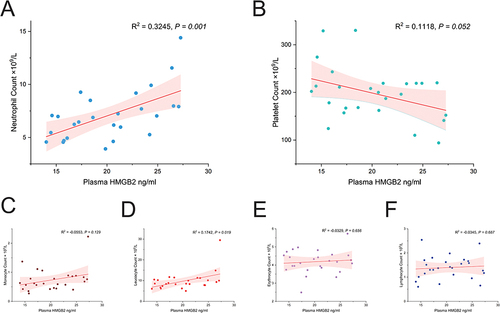
Figure 3 Gene Ontology (GO) analysis. (A) Eight biological processes (BP) were enriched in STEMI patients. (B) Enrichment results of the cellular components (CC). (C) Eight molecular functions (MF) were enriched in STEMI patients. STEMI: ST-segment elevation myocardial infarction.
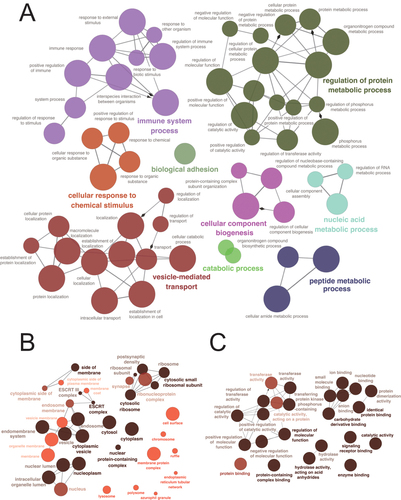
Figure 4 KEGG enrichment analysis and Gene Set Enrichment Analysis (GSEA). (A) KEGG showed that six platelet related functions were significantly changed in platelets of patients with STEMI. (B) GSEA showed that five functional pathways were significantly activated in STEMI patients. (C) GSEA showed that five functional pathways were significantly inhibited in STEMI patients. KEGG: Kyoto Encyclopedia of Genes and Genomes; STEMI: ST-segment elevation myocardial infarction.
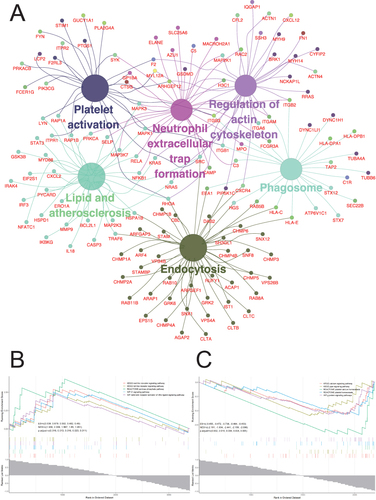
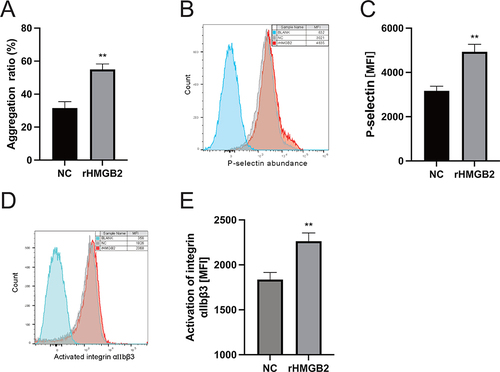
Figure 5 Effects of HMGB2 on Platelet activation. (A) platelet aggregation induced by ADP was enhanced by using rHMGB2. (B and C) CD62P expression on platelet surface was enhanced by using rHMGB2. (D and E) Activation of platelet integrin αIIbβ3 was enhanced by using rHMGB2. MFI: mean fluorescence intensity. **P < 0.01 vs the NC group.