Figures & data
Figure 1 Expression levels of CD48 in pan-cancer and relative normal tissues based on (A) TIMER and (B) TCGA databases. *p < 0.05, **p < 0.01, ***p < 0.001.
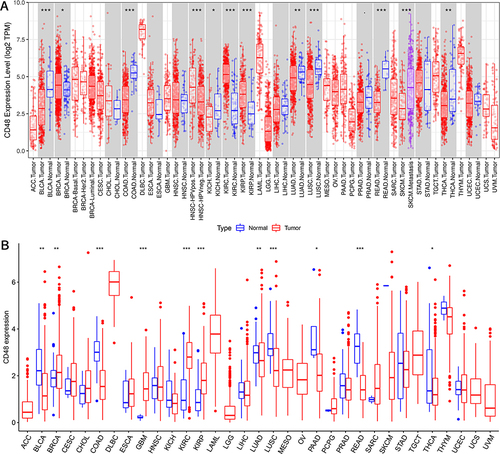
Figure 2 Prognostic analysis based on CD48 expression levels through univariate Cox analysis. Relationships of CD48 expression levels and (A) OS, (B) DSS, (C) DFI, as well as (D) PFI through univariate Cox analysis.
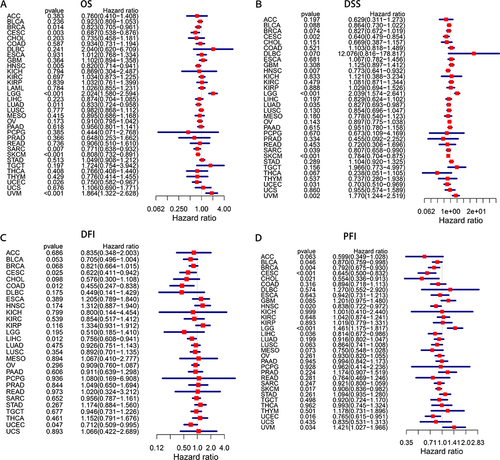
Figure 3 Prognostic analysis based on CD48 expression levels through Kaplan-Meier curve analysis. Relationships of CD48 expression levels and (A) OS, (B) DSS, (C) DFI, as well as (D) PFI through Kaplan-Meier curve analysis.
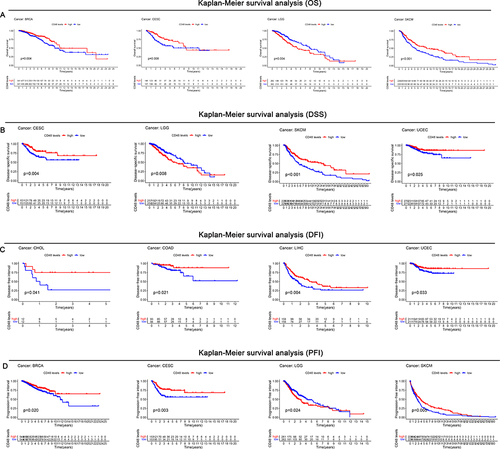
Figure 4 Relationship of clinical phenotype and CD48 expression. (A-E) Relationship of stage and CD48 expression in COAD, KIRC, LUAD, SKCM, and TGCT. (F-M) Relationship of age and CD48 expression in BRCA, LAML, ESCA, LUAD, LIHC, LGG, STAD and SKCM. (N-Q) Relationship of gender and CD48 expression in BLCA, BRCA, LUAD, and LUSC.
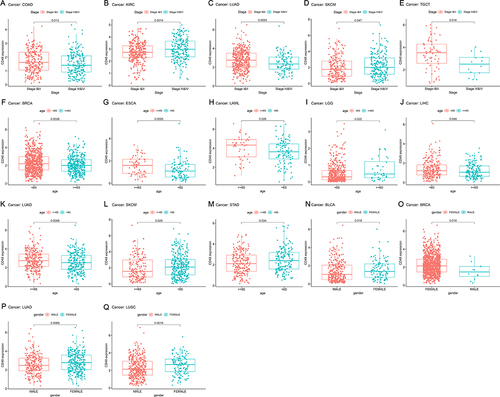
Figure 5 Relationships of CD48 expression and different components in TME. (A) Relationship of CD48 expression and immune components in some cancer. (B) Relationship of CD48 expression and stromal components in some cancer.
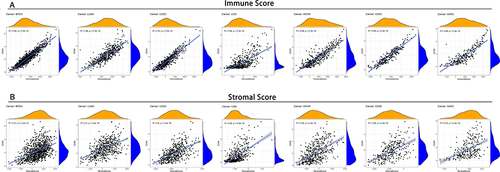
Figure 6 Relationship of CD48 expression and levels of infiltrating immune cells. Relationships of CD48 and levels of (A) naive B cells, (B) M1 macrophages, (C) monocytes, (D) neutrophils, (E) plasma cells, (F-I) T cells, (J) resting dendritic cells, (K) CD8 T cells, (L) activated mast cells, (M) activated dendritic cells, (N) resting NK cells, (O and P) M0 and M2 macrophages, (Q) resting mast cells, (R) resting CD4 memory T cells, (S) memory B cells, and (T) activated NK cells.
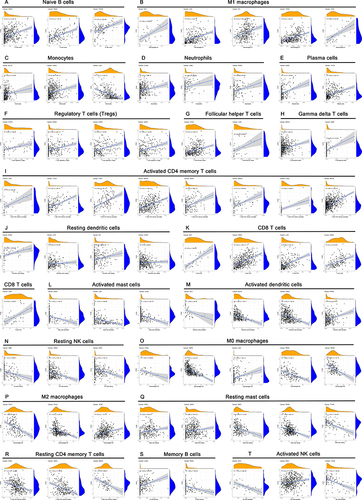
Figure 7 Relationship of immunity-related genes, TMB, MSI, TIDE, and CD48 expression. Relationships of CD48 expression and (A) immunity-related genes, (B) TMB, (C) MSI, and (D and E) TIDE. *p < 0.05, **p < 0.01, ***p < 0.001.
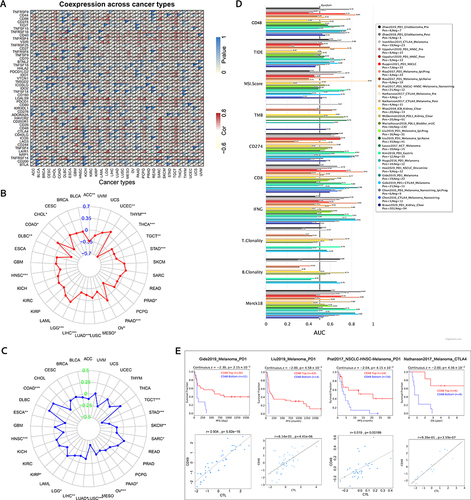
Figure 8 Biological function of CD48 in pan-cancer based on GSEA. (A-G) GO functional terms of CD48 in BRCA, UCEC, LUAD, LGG, SKCM, SARC, and CESC. (H-M) KEGG pathway analysis of CD48 in LUAD, CESC, SARC, SKCM, LGG, and UCEC.
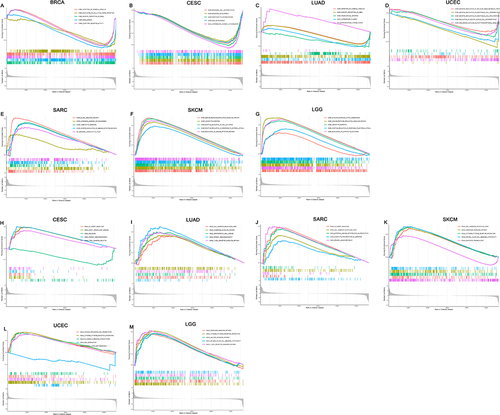
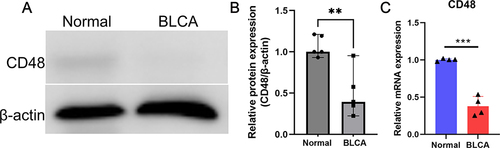
Figure 9 Western blotting and qPCR. (A) Western blotting confirmed the differential expression of CD48 in BLCA. (B) Gray value analysis of relative CD48 expression. (C) Comparison of CD48 gene mRNA expression between normal and tumor tissues in BLCA by qPCR. *p < 0.05, **p < 0.01, ***p < 0.001.