Figures & data
Figure 1 Volcano plots and heatmaps of DEGs. (A) Volcano plot of DEGs in GSE33335 dataset. (B) Heatmap of DEGs in GSE33335 dataset. (C) Volcano plot of DEGs in GSE79973 dataset. (D) Heatmap of DEGs in GSE79973 dataset. (E) Volcano plot of DEGs in TCGA data. (F) Heatmap of DEGs in TCGA data. (G) Venn diagram of DEGs.
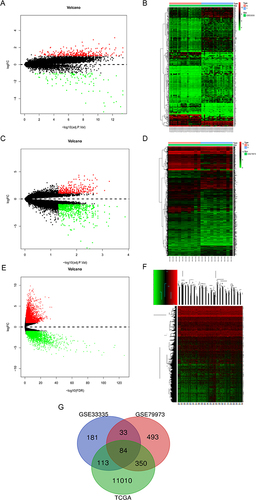
Figure 2 The GO and KEGG functional enrichment analyses of overlapping DEGs in gastric cancer. (A) The GO term, biological processes of common DEGs. (B) The GO term, cellular composition of common DEGs. (C) The GO term, molecular function of common DEGs. (D) KEGG pathway enrichment analyses of common DEGs.
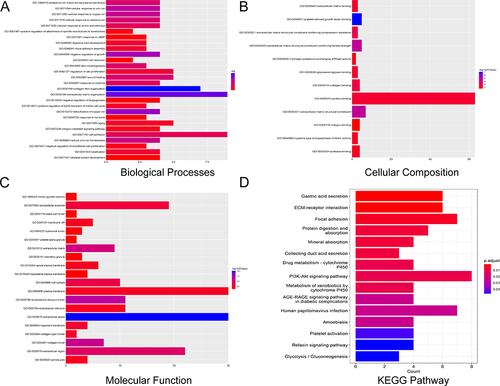
Figure 3 Protein interaction network diagram of common DEGs and identifying of hub genes. (A) The protein interaction network diagram of the common DEGs using online analysis tool STRING. (B) The ranking column chart of the hub genes by R software (top 30 genes).
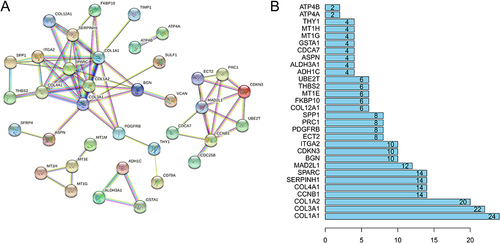
Figure 4 Validation of selected hub genes expression in gastric cancer tissues and normal tissues using GEPIA database. ((A–J): COL1A1, COL3A1, COL1A2, CCNB1, COL4A1, SERPINH1, SPARC, MAD2L1, BGN and CDKN3). *P < 0.05.
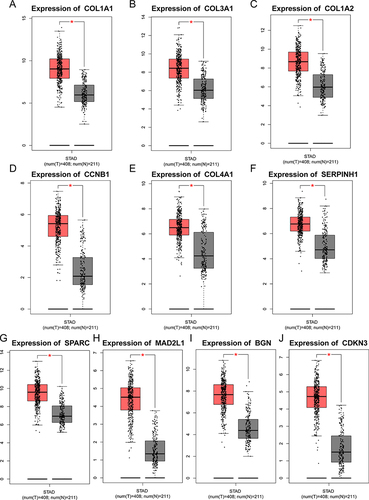
Figure 5 The validation of prognostic value of 10 genes. ((A–J): COL1A1, COL3A1, COL1A2, CCNB1, COL4A1, SERPINH1, SPARC, MAD2L1, BGN and CDKN3).
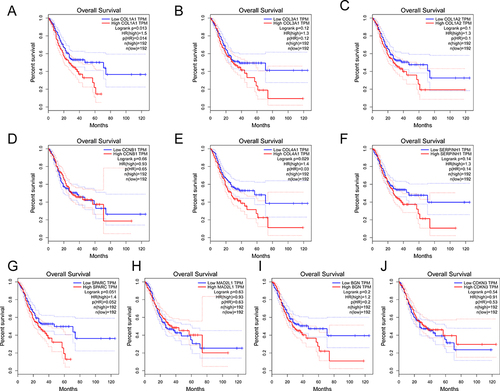
Figure 6 Correlation between the expression of prognostic genes and clinicopathological features of GC (Ualcan database). (A) The expression of 2 prognosis-related genes in GC. (B) Correlation between expression of 4 prognosis-related genes and tumor stages in GC patients. (C) Expression of 2 prognosis-related genes in GC based on nodal metastasis status. (D) Expression of 2 prognosis-related genes in GC based on tumor grades. *P < 0.05, ***P < 0.001.
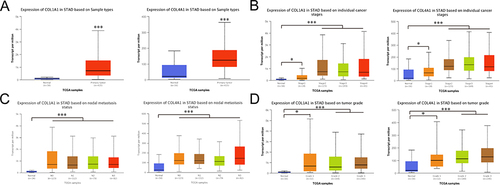
Figure 7 The immunohistochemical-based protein expression of 2 prognosis-related genes in GC tissues and adjacent normal tissues.
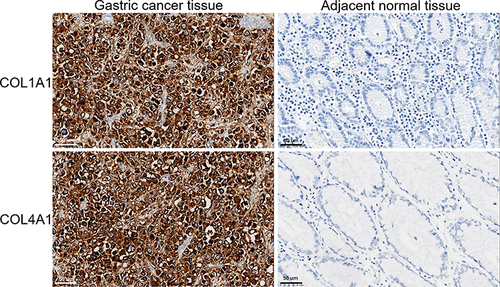
Table 1 Relationship Between Prognosis-Related Genes and Clinicopathological Features in Patients with GC
Table 2 Relationship Between 5-Year Survival Rate and Clinicopathological Features in Patients with GC
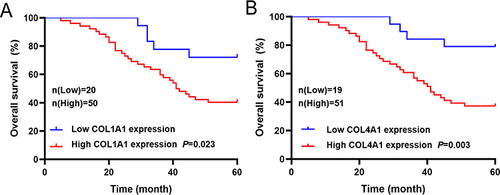
Figure 8 Relationship between prognosis-related genes expression level and 5-year survival rate of patients with GC (n=70). (A) Relationship between COL1A1 expression level and 5-year survival rate of patients with GC. (B) Relationship between COL4A1 expression level and 5-year survival rate of patients with GC.