
Figures & data
Table 1 Demographic and Baseline Characteristics of Stroke Patients Admitted TO ACSH from November 1, 2018 - October 31, 2019
Figure 1 Proportion of Risk factors among patients with at least one identified risk factor in ACSH.
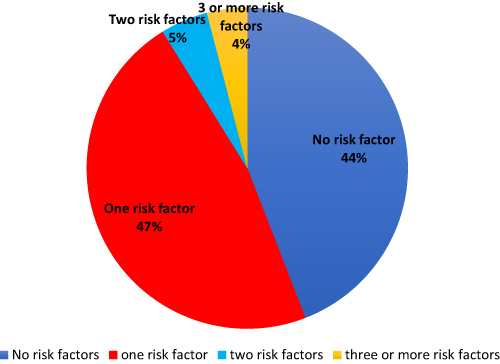
Figure 2 Numbers of identified risk factors in stroke patients admitted to ACSH, November 1, 2018 -October 2019.
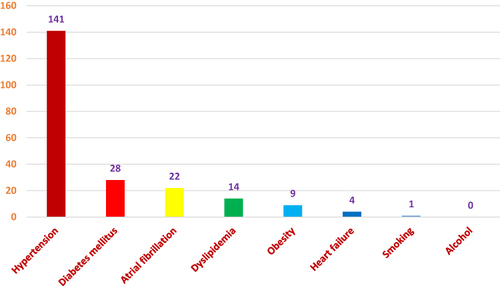
Figure 3 Identified risk factors among 272 stroke patients admitted to ACSH from November 1, 2018 -October 31, 2019.
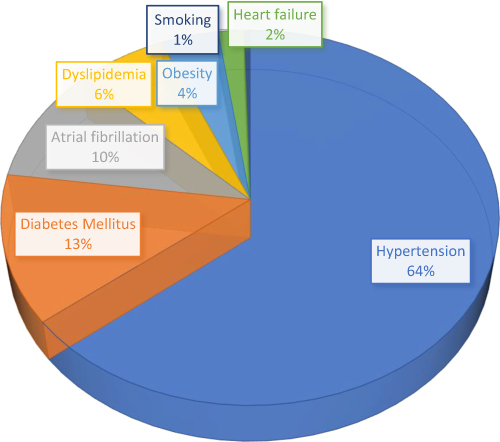
Table 2 Outcome and Complications of Stroke Patients Admitted to ACSH from November 1, 2018–October 31, 2019
Table 3 Predictors of in-Hospital Mortality Among Patients Admitted with the Diagnosis of Stroke, ACSH, n=272