
Figures & data
Table 1 Participants’ Sociodemographic and Professional Characteristics (n=364)
Figure 1 Type of Physical Activities.
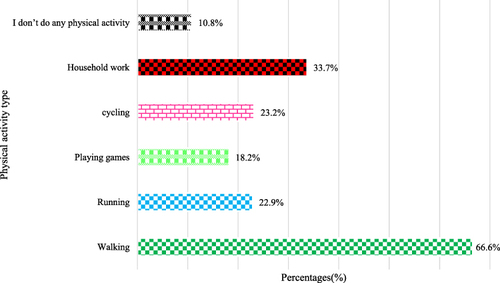
Table 2 Knowledge About CVD Risk Factors Among the Participants (n=362)
Figure 2 Participants responses towards preventative measures(PM) of CVD.
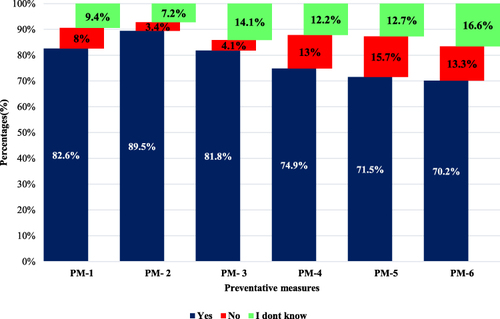
Figure 3 Levels of Knowledge among respondents.
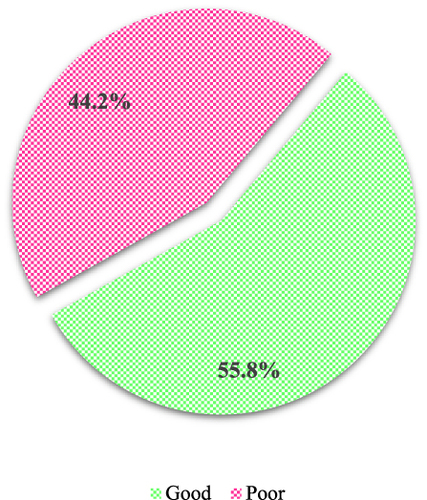
Table 3 Mean Knowledge of CVD Risk Factors and Preventative Measures Scores and Distribution Among the Studied Population (n=331)
Table 4 Cross-Tabulation Between Demographic Characteristics and Knowledge of CVD Risk Factors and Preventative Measures Scores Categories