Figures & data
Figure 1 Flow chart. Created with Biorender.com.
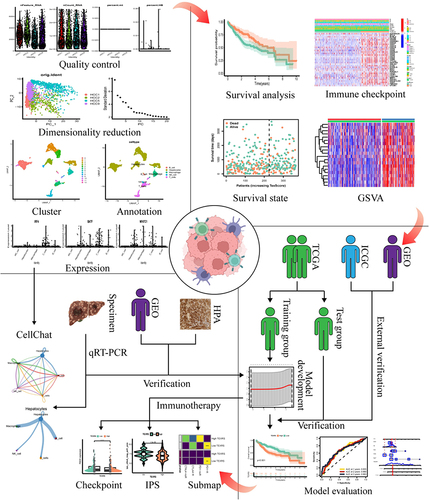
Table 1 Clinical Information of HCC Patients
Table 2 Clinical Information for Training and Test Groups
Table 3 Primer Sequence
Figure 2 scRNA-seq analysis. (A) GSE146115 data is clustered into 13 clusters; (B) GSE146115 data annotation for five cell types; (C) Regulation of the distribution of T cell exhaustion transcription factors in each cell type; (D) Regulate the expression of T cell exhaustion transcription factors in various cell types. scRNA-seq, single-cell RNA sequencing.
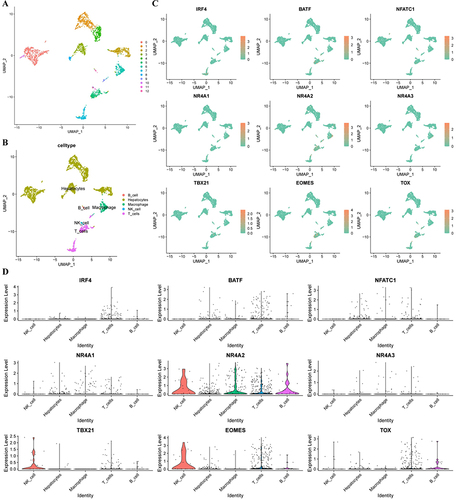
Figure 3 There are obvious differences between high and low TexScore. (A) Survival curve of high and low TexScore; (B) Distribution of TexScore and its relationship with survival state; (C) Expression of immune checkpoints of high and low TexScore; (D) GSVA of high and low TexScore. TexScore, T cell exhaustion score; GSVA, Gene set variation analysis.
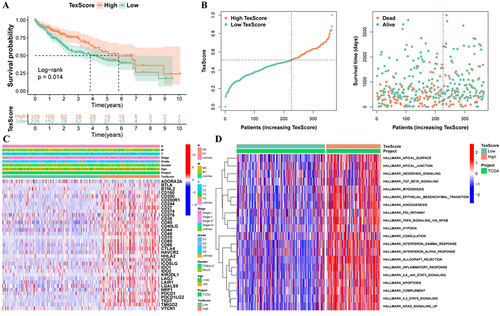
Figure 4 Development of TEXRS. (A) The TCGA cohort was randomly divided into the training group and the test group at a ratio of 7:3; (B) Lasso regression analysis; (C–E) In the training group, TEXRS distribution, relationship with survival state, model gene expression, survival curve and ROC curve; (F–H) In the test group, TEXRS distribution, relationship with survival state, model gene expression, survival curve and ROC curve; (I–K) In the total group, TEXRS distribution, relationship with survival state, model gene expression, survival curve and ROC curve. TEXRS, T cell exhaustion risk score; ROC, receiver operating characteristic.
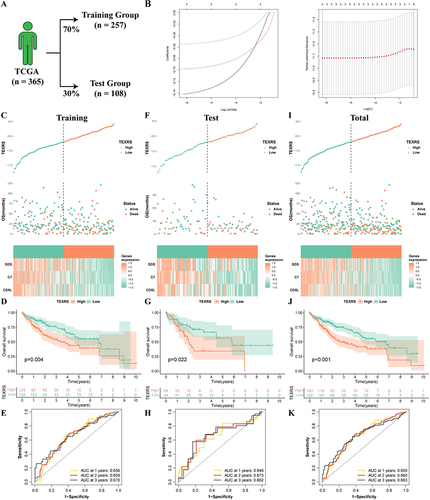
Figure 5 Analysis of TEXRS and clinical characterizations. (A) Comparison of TEXRS among different clinical characterizations; (B) The proportion of different clinical characterizations of high and low TEXRS; (C) Univariate cox analysis of TEXRS and clinical features; (D) Multivariate cox analysis of TEXRS and clinical characterizations; (E) A nomogram of TEXRS and clinical characterizations; (F) ROC analysis of the nomogram; (G) Calibration curve of the nomogram. ***P < 0.001. ROC, receiver operating characteristic.
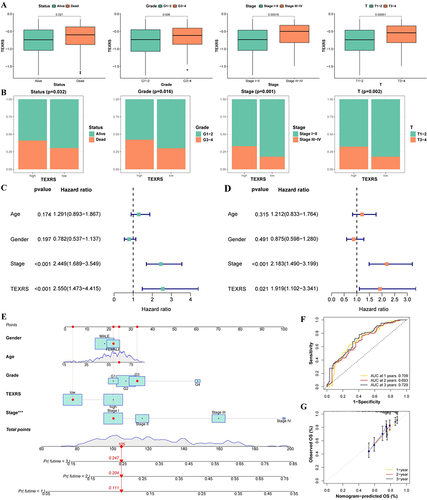
Figure 6 TEXRS testing in external validation (ICGC cohort). (A) Survival curve of high and low TEXRS; (B) ROC curve; (C) Analysis of TEXRS and clinical characterizations; (D) Univariate cox analysis of TEXRS and clinical characterizations; (E) Multifactorial cox analysis of TEXRS and clinical characterizations; (F) A nomogram of TEXRS and clinical characterizations; (G) ROC analysis of the nomogram; (H) Calibration curve of the nomogram. *P < 0.05, **P < 0.01, ***P < 0.001. TEXRS, T cell exhaustion risk score; ROC, receiver operating characteristic.
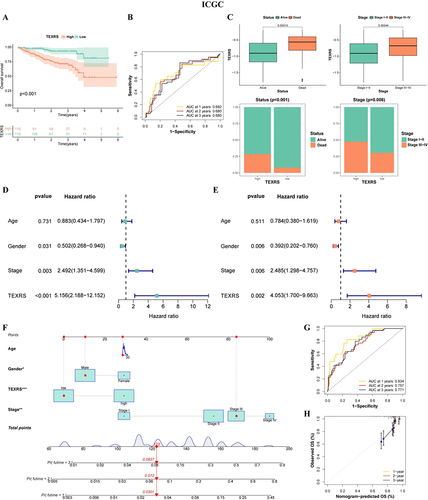
Figure 7 Different immune microenvironments existed in high and low TEXRS groups. (A) ESTIMATE score of high and low TEXRS; (B) Immune cell infiltration of high and low TEXRS. *P < 0.05, ***P < 0.001. TEXRS, T cell exhaustion risk score.
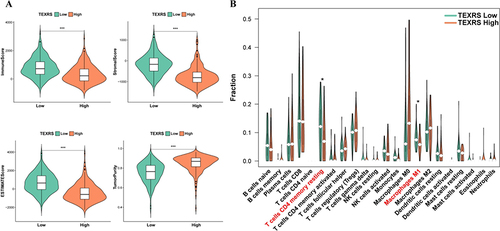
Figure 8 TEXRS predicts immunotherapy and TACE performance. (A) Expression of CTLA4, PDCD1 and CD274 in high and low TEXRS; (B) PDL1 expression of high and low TEXRS in proteomic data; (C) IPS expression of high-low TEXRS (D) Submap algorithm predicted the therapeutic effect of high and low TEXRS; (E) There were significant differences in TEXRS in patients who did not respond to TCIA treatment; (F) ROC curve for TEXRS to predict TCIA effect. **P < 0.01, ***P < 0.001. TACE, transcatheter arterial chemoembolization; IPS, immunophenoscore; ROC, receiver operating characteristic.
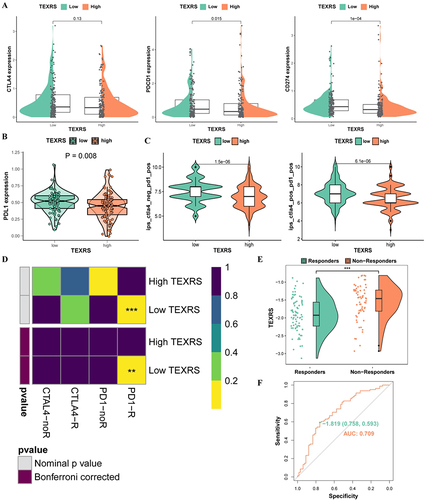
Figure 9 Stability of model gene expression at transcriptional level. Expression of C7 (A), CD5L (B) and SDS (C) in unpaired and paired pairs in the TCGA cohort; (D–F) Expression of C7, CD5L and SDS in the GEPIA database; (G–I) Expression of C7, CD5L and SDS in the GSE14520 dataset; (J–L) The expression of C7, CD5L and SDS was detected by RT-qPCR; Expression of C7, CD5L, and SDS in unmatched tissues in the GSE36376 (M) and GSE45436 (N) datasets. *P < 0.05, ***P < 0.001.
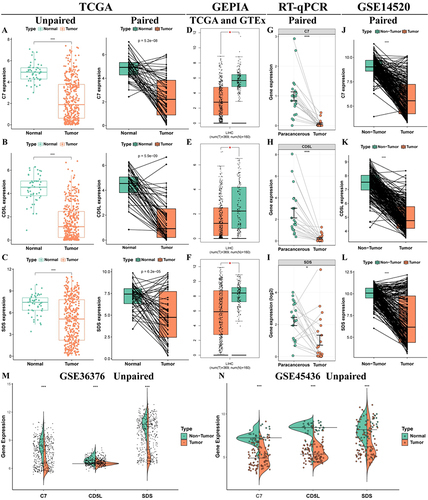
Figure 10 Stability of model gene expression at protein level.
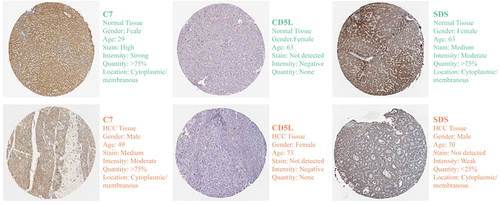
Figure 11 Distribution of model genes in a scRNA-seq dataset and correlation analysis with regulatory Tex transcription factors. (A) GSE146115 data annotation for five cell types; (B) Distribution of C7, CD5L and SDS in each cell type; (C) Annotated as ten cell types in the GSE140228 Smartseq2 dataset; (D) Expression of C7, CD5L and SDS in various cell types; (E) Correlation analysis of C7, CD5L and SDS with regulatory Tex transcription factors; (F) Correlation analysis of CD5L with TBX21 and EOMES. *P < 0.05, **P < 0.01, ***P < 0.001. scRNA-seq, single-cell RNA sequencing; Tex, T cell exhaustion.
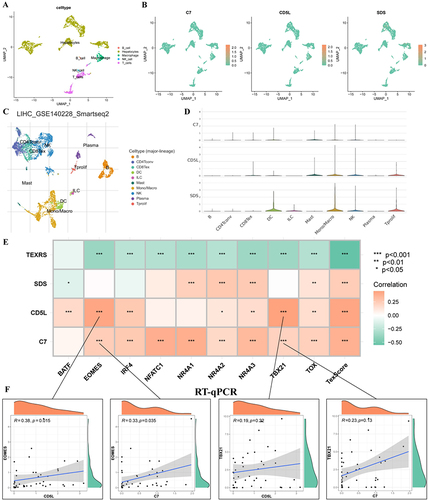
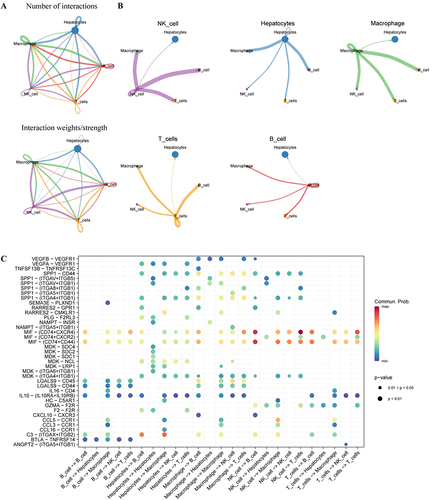
Figure 12 Cell communication analysis of scRNA-seq data. (A) GSE146115 data cell communication networks for five cell types; (B) How each cell interacts with other cells; (C) Bubble maps of receptor-mediated cell communication. scRNA-seq, single-cell RNA sequencing.