
Figures & data
Table 1 The Primer Sequences of Biomarkers
Figure 1 Identification of differentially expressed genes (DEGs). (A) Heatmap of DEGs between the uremia and control groups. Red and blue indicate upregulation and downregulation, respectively. (B) Volcano map of DEGs between the uremia and control groups.
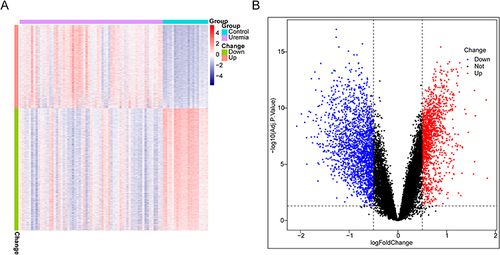
Figure 2 Weighted gene co-expression network analysis (WGCNA). (A) Sample cluster dendrogram of 20 control samples and 63 uremia samples based on their expression profile. (B) Analysis of mean connectivity of each β value from 1 to 20. β = 17 was chosen for subsequent analyses as it has the biggest mean connectivity when the scale-free fit index is up to 0.85. (C) Heatmap of the module-trait correlation. The brown module exhibited the highest correlation with uremia. (D) Scatter plot of correlation between genes and traits in the MEbrown module. (E) Venn diagram representation of the intersection of differentially expressed genes (DEGs), immune-related genes from the ImmPort database, and the brown module. In total, 124 core DEGs were identified.
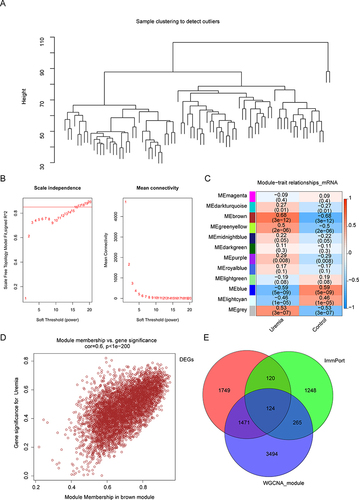
Figure 3 Gene Ontology (GO) and Kyoto Encyclopedia of Genes and Genomes (KEGG) enrichment analyses. (A) GO functional enrichment analysis of the differentially expressed immune-related genes (DEIRGs) with the top 10 biological process (BP) and molecular function (MF) terms and the top nine cellular component (CC) terms. The horizontal coordinate shows the ratio of the enriched gene count to the total number of genes input, while the vertical coordinate shows the GO terms. (B) The top 20 significantly enriched KEGG pathways of the DEIRGs.
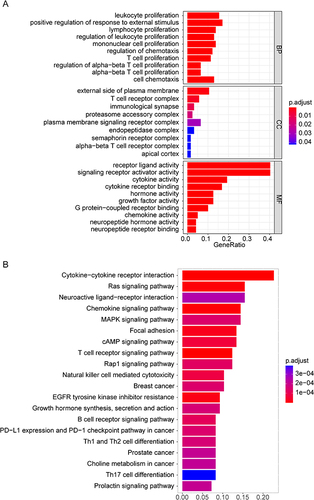
Figure 4 Protein-protein interaction (PPI) network. (A) PPI network of the 99 differentially expressed immune-related genes (DEIRGs). (B) Venn diagram showing the intersection of the candidate key genes obtained using the degree, maximal clique centrality (MCC), and stress algorithms.
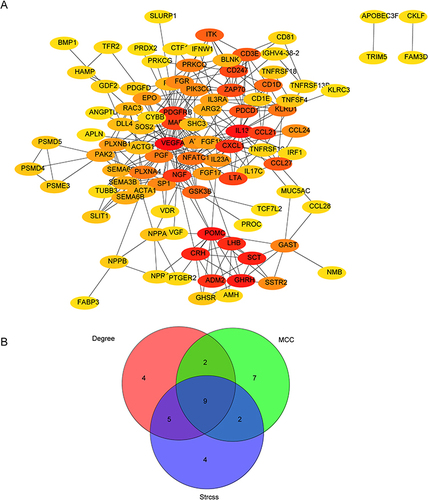
Figure 5 Evaluation of the diagnostic value of biomarkers and validation of hub biomarkers. (A) Cumulative residual distribution of samples. (B) Boxplot of sample residuals. (C) The importance of the variables in the random forest (RF) model, generalized linear model (GLM), and support vector machine-recursive feature elimination (SVM-RFE) model. (D) The importance of RF models. (E and F) Receiving operating characteristic (ROC) curves were used to evaluate the ability of the model to distinguish uremia cases from healthy controls. (G) Validation of hub genes in the GSE37171 datasets. The results of validation set analysis were consistent with those of training set analysis. ***p<0.001.
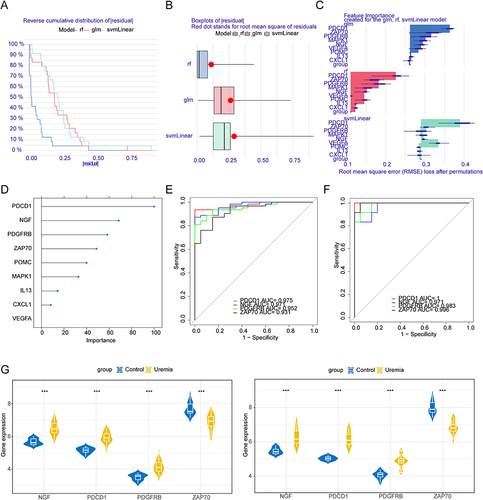
Figure 6 Establishment of the nomogram model in the uremia training cohort. (A) Nomogram model of uremia. (B) Decision curve for the nomogram model. (C) Clinical impact curve for the nomogram model.
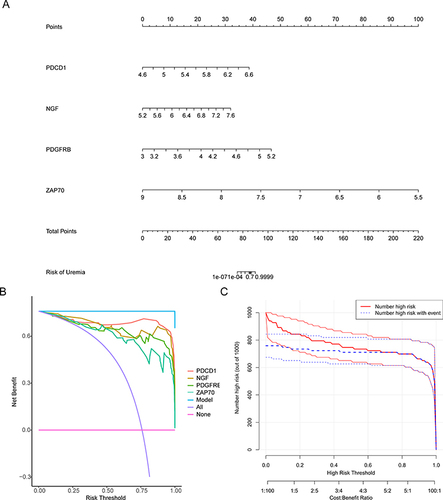
Figure 7 Analysis of the immune microenvironment. (A) Wind rose graph of immune cell content in control (left) and uremia samples (right). (B) Boxplot of the differential immune cell content between the uremia and control groups. *p<0.05; **p<0.01; ***p<0.001. (C) Correlation between key genes (PDCD1, NGF, PDGFRB, and ZAP70) and immune cells.
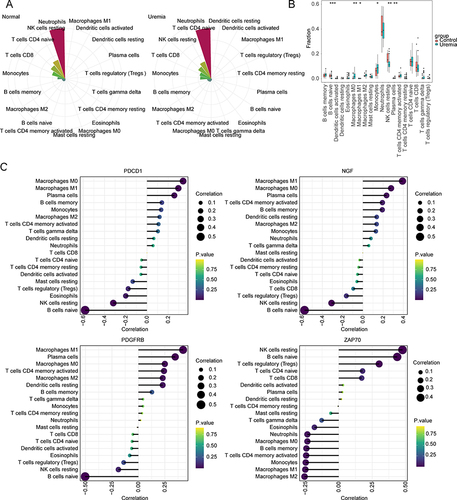
Figure 8 Gene set enrichment analysis (GSEA). (A–D) Gene ontology (GO) enrichment analysis of PDCD1, NGF, PDGFRB, and ZAP70 gene set. (E–H) Kyoto Encyclopedia of Genes and Genomes (KEGG) analysis of PDCD1, NGF, PDGFRB, and ZAP70 gene set.
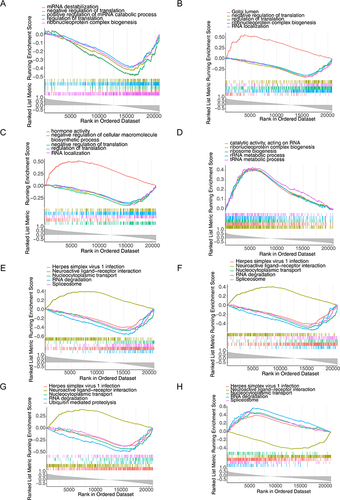
Figure 9 Ingenuity pathway analysis. (A) Classical pathway of differentially expressed genes (DEGs). The abscissa is the path name, while the ordinate is the −log (p-value). The yellow line is the default threshold of p = 0.05. Orange and blue colors indicate the activated and inhibited pathways, respectively. The intensities of Orange and blue indicate the degree of activation and inhibition, respectively. (B) The natural killer (NK) cell signaling pathway was ranked first among the signaling pathways with |z-score| >2. IPA predicted that ZAP70 regulates the NK signaling pathway.
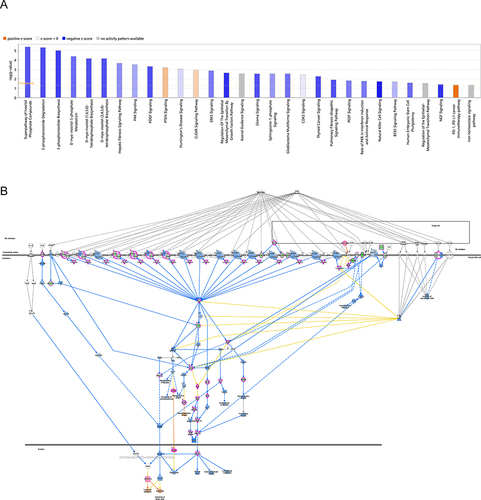
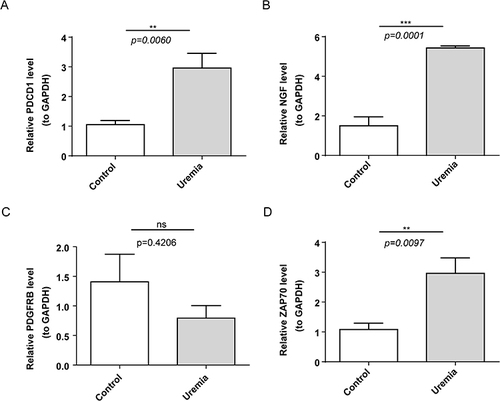
Figure 10 Validation of the expression levels of biomarkers. (A–D) Expression levels of PDCD1, NGF, PDGFRB, and ZAP70 in the uremia and control groups. ns, not significant;** p<0.01; ***p<0.001.
Data Sharing Statement
The datasets used in this study were downloaded from the GEO (https://www.ncbi.nlm.nih.gov/geo/), STRING (http://string-db.org), and ImmPort (https://immport.niaid.nih.gov) databases. All data generated or analyzed during this study are included in this published article. The readers can contact Dongning Lyu (Email [email protected]) for queries.