Figures & data
Table 1 Characteristics of the Study Participants
Figure 1 Flowchart of the study population. Of the 2254 study participants in the LOHAS 2008, 489 (21.7%) were included in the present study for statistical analysis.
Abbreviation: LSS, Lumbar spinal stenosis.
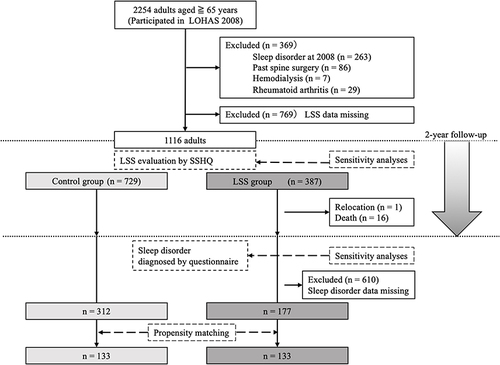
Table 2 Comparison of Characteristics Between the Two Groups After Propensity Score Matching
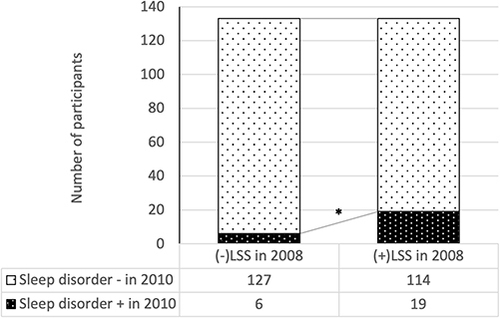
Figure 2 Relationship between presence of LSS in 2008 and occurrence of sleep disorder in 2010. *P = 0.0063.
Abbreviation: LSS, Lumbar spinal stenosis.