Figures & data
Figure 1 Example of exponential growth with various days to peak.
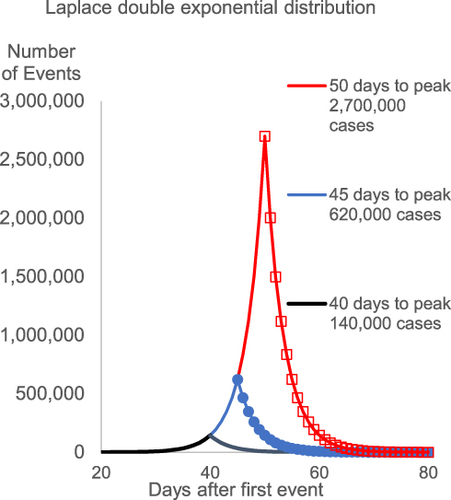
Figure 2 Examples of forecasts based on 20-day input data after 50 deaths.
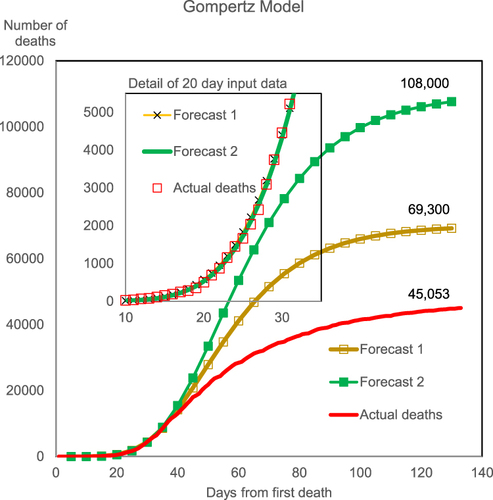
Table 1 UK COVID-19 Deaths. Johns Hopkins University (Worldometer) Data
Figure 3 Chart of daily change of reported deaths with linear regression.
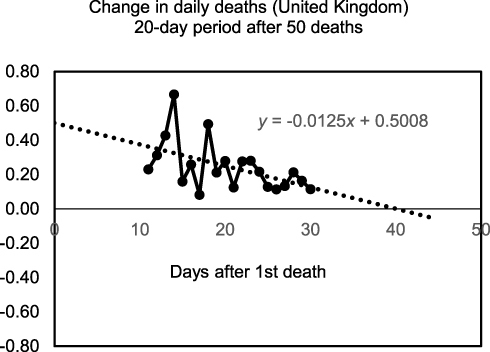
Table 2 COVID-19 Mortality: Asymmetric Model Parameters and Forecasts Based on JHU Worldometer Reported Data and Office for National Statistics for England and Wales
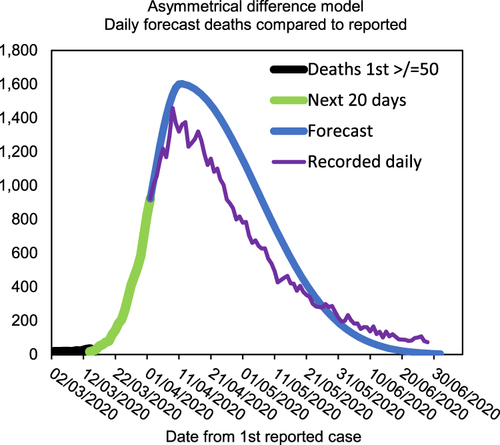
Figure 4 Model input data for 20 days after 50th death and output compared to actual data.
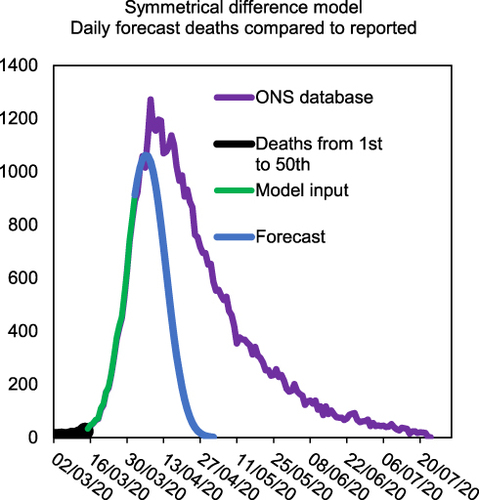
Figure 5 A chart created from ONS data for Influenza like illness (ILI) for the years 1999–2014 showing the trajectory of excess deaths.
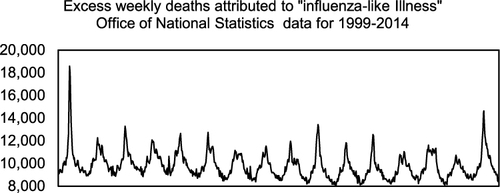
Table 3 Ratio of the Growth and Decline Phases of Influenza Like Illness Outbreaks
Figure 6 Details of weekly ILI excess deaths with estimates for the number of days to the peak and for the decline to normal levels. X axis data is Week number after outbreak.
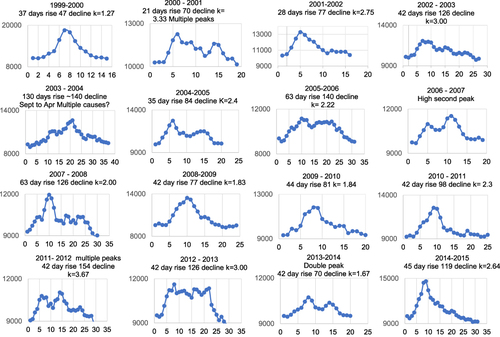
Figure 7 Diagram of parameters for the asymmetric model.
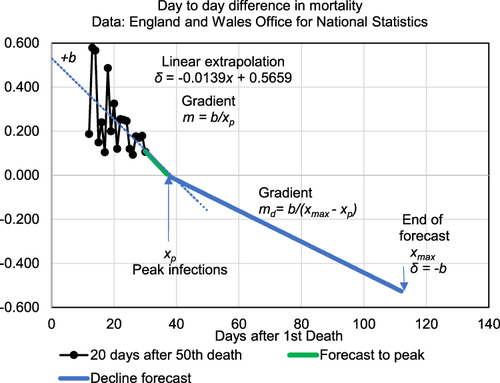
Figure 8 A comparison of cumulative, daily and daily change in mortality for three models.
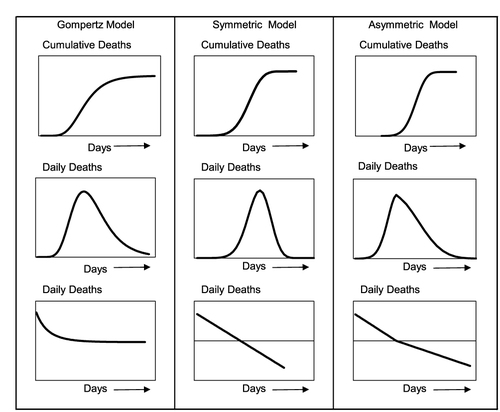
Figure 9 Comparison of model and total deaths reported on 30 June 2020.
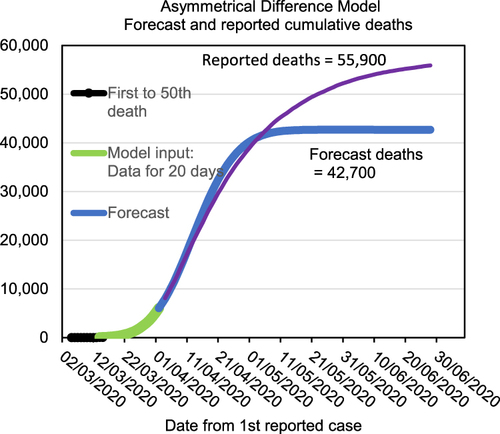
Figure 10 Comparison of model to actual daily deaths reported on 30 June 2020.