Figures & data
Table 1 Basic Characteristics of the Study Subjects
Table 2 Pearson’s Correlation Coefficients Between Lp-PLA2 Levels and Cardiometabolic Risk Factors in Men and Women
Table 3 Clinical and Metabolic Characteristics According to Lp-PLA2 Status
Table 4 Logistic Regression Analysis of Lp-PLA2 Level and Metabolic Syndrome
Table 5 Cut-off Value and Prediction Power for TG/HDL-C, Waist-to-Height Ratio (WHtR), and Lipoprotein-Associated Phospholipase A2 (Lp-PLA2)
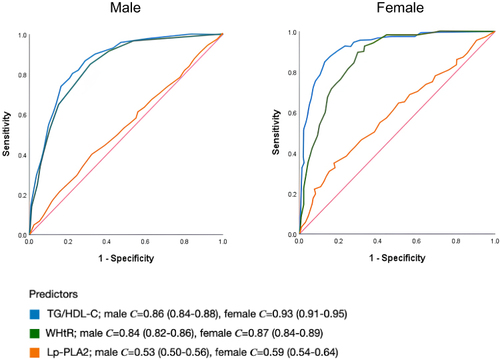
Figure 1 ROC curves assessing diagnostic performance of TG/HDL-C, WHtR, and Lp-PLA2 Stratified by Gender. ROC curves illustrate the discriminatory ability of TG/HDL-C, WHtR, and Lp-PLA2 for predicting Mets, with gender-specific analysis. In males, TG/HDL-C (C = 0.86, 95% CI: 0.84–0.88) and WHtR (C = 0.84, 95% CI: 0.82–0.86) showed strong performance, while Lp-PLA2 had lower discrimination (C = 0.53, 95% CI: 0.50–0.56). Among females, TG/HDL-C excelled (C = 0.93, 95% CI: 0.91–0.95), surpassing WHtR (C = 0.87, 95% CI: 0.84–0.89). Lp-PLA2 exhibited weaker discrimination (C = 0.59, 95% CI: 0.54–0.64). These findings highlight gender-specific variations in biomarker efficacy for Mets diagnosis, emphasizing the need for gender-specific analyses.