Figures & data
Table 1 Severity Scale for Cerebral Venous Thrombosis
Table 2 Baseline Characteristics and Clinical Manifestations of Patients with Cerebral Venous Thrombosis
Table 3 Rotated Factor Loadings for the Severity Scale
Figure 1 The CVT severity scale is positively correlated with ICP, NIHSS and mRS (A–C), and negatively correlated with GCS (D) at baseline.
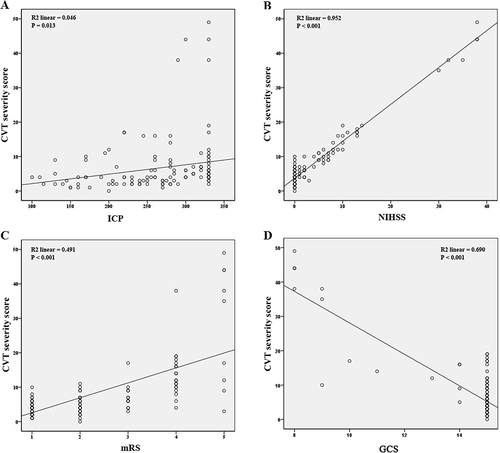
Figure 2 ROC curve showed that the CVT severity scale > 3.5 indicated IH (A). Further analysis revealed that patients with CVT severity scale > 3 suffered from higher ICP compared with those with CVT severity scale ≤ 3 (B). Factor 3 (IH) > 2.5 also indicated IH (C). Further analysis revealed that patients with factor > 2 suffered from higher ICP compared with those with factor ≤ 2 (D). * p < 0.05.
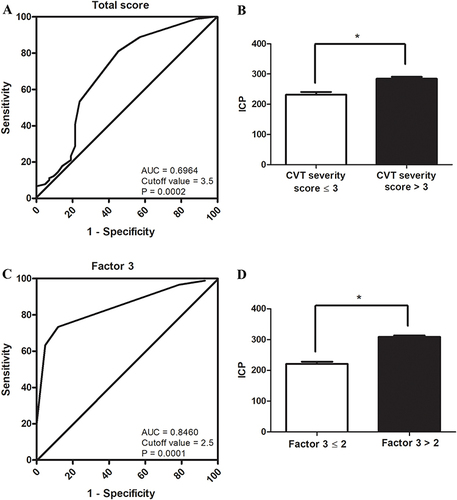
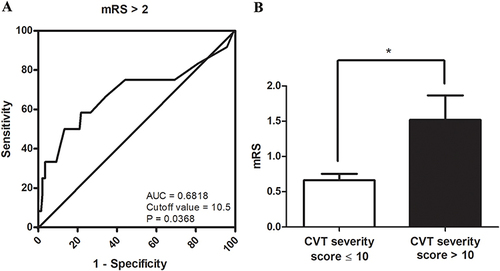
Figure 3 ROC curve showed that the CVT severity scale > 10.5 indicated mRS > 2 at 6 months of follow-up (A). mRS in patients with CVT severity scale > 10 is significantly lower than those with CVT severity scale ≤ 10 (B). * p < 0.05.