Figures & data
Table 1 Baseline Characteristics of Case and Control Group (n,%)
Figure 1 Correlation between MUC4 variants and prognosis in CRC patients.(A) Kaplan–Meier DFS curves for CRC patients with rs56359992 and without rs56359992. (B) Kaplan–Meier DFS curves for CRC patients with rs1560322790 and without rs1560322790. (C) Kaplan–Meier DFS curves for CRC patients with rs781124621 and without rs781124621.
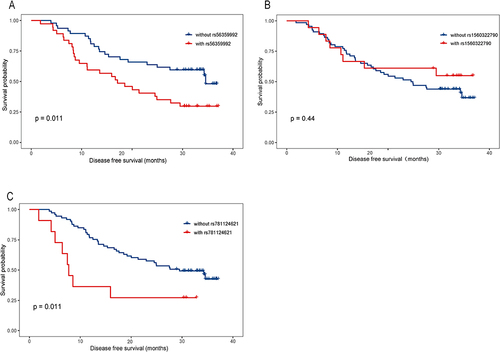
Figure 2 Relationship between MUC4 variants and CRC metastasis after radical surgery. The barplot showed the proportion of CRC patients with metastasis. **p<0.01.
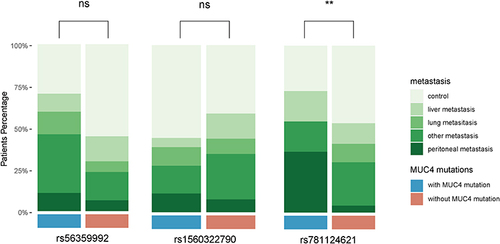
Figure 3 Relationship between variant rs781124621 and peritoneal metastasis. ****p<0.0001.
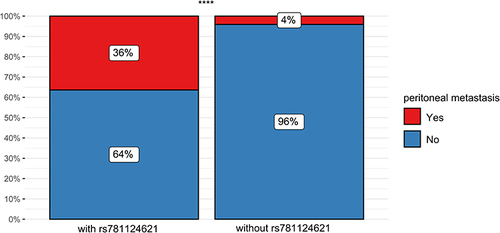
Figure 4 Analysis of biological activity associated with MUC4 mutations. (A) The volcano plot of the DEGs. (B) Gene ontology enrichment analysis. (C) Kyoto Encyclopedia of Genes and Genome pathway enrichment analysis. (D) Gene set enrichment analysis.
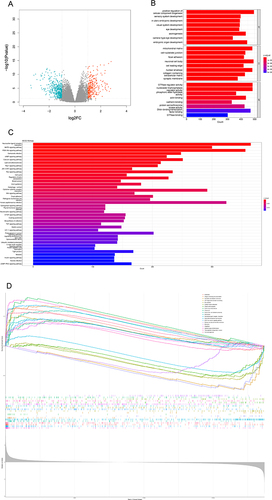
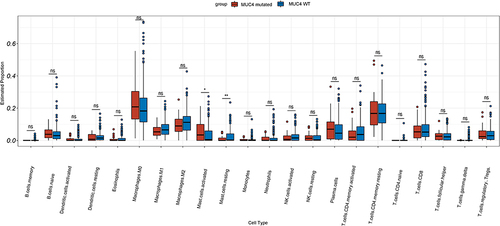
Figure 5 Immunescore of MUC4 mutated group and MUC4 WT group. *p<0.05.
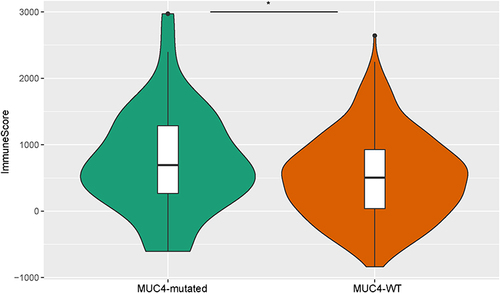
Figure 6 Distributions of immune cells in MUC4 mutated group and MUC4 WT group. *p<0.05; **p<0.01.