Figures & data
Table 1 Clinical Characteristics of Patients with NSCLC from Public Databases
Table 2 The Clinical Characteristics of Patients with NSCLC from Our Cohort
Figure 1 Levels of IER5L expression in 23 kinds of cancers and corresponding controls from GEPIA2 database. (A) BLCA, BRCA, CESC, CHOL, COAD, ESCA, NHSC. (B) KICH, KIRC, KIRP, LIHC, LUAD, LUSC, PAAD, PCPG. (C) PRAD, READ, SARC, SKCM, STAD, THCA, THYM, UCEC. *P < 0.05.
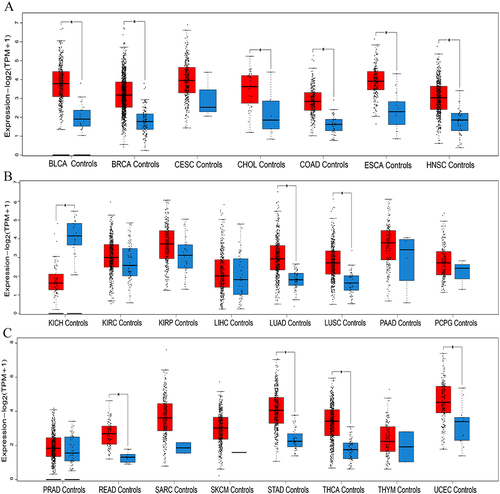
Figure 2 Kaplan-Meier survival analysis of IER5L in different tumors. (A-H) Overall survival between the two IER5L groups in CESC, KIRP, LGG, LIHC, NSCLC, OV, READ, and UVM. (I-O) Disease free survival between the two IER5L groups in BRCA, KIRP, NSCLC, PAAD, PRAD, READ, and UVM.
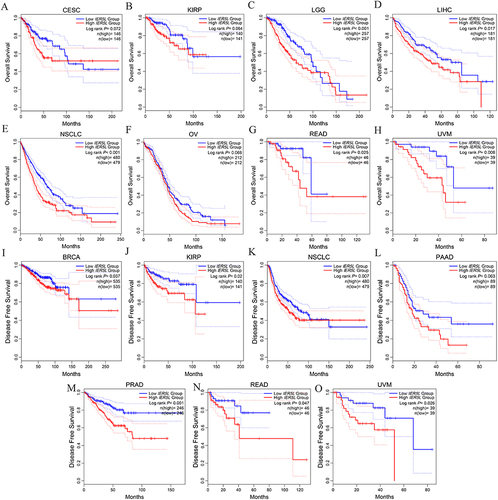
Figure 3 Correlation of IER5L expression with tumor stages. (A) ACC. (B) CESC. (C) DLBC. (D) ESCA. (E) KICH. (F) LIHC. (G) TGCT. (H) THCA. (I) UCS. IER5L, immediate early response 5 like.
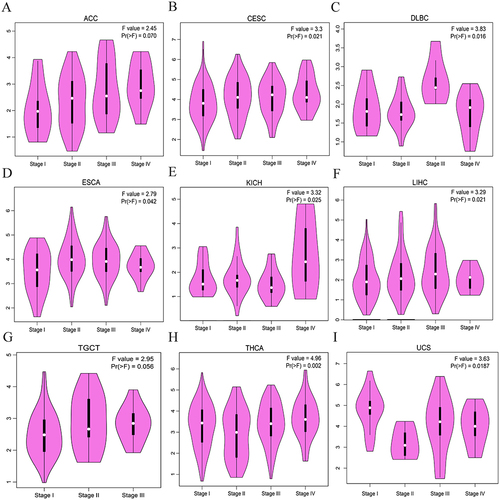
Figure 4 Levels of IER5L expression and its diagnostic value in NSCLC. (A) Levels of IER5L expression in NSCLC and corresponding controls from the TCGA. (B) Receiver operating characteristic curve of IER5L in NSCLC. (C-E) Levels of IER5L expression in NSCLC and corresponding controls from the GSE31210, GSE30219, and qPCR validation. IER5L, immediate early response 5 like; NSCLC, non-small cell lung cancer; TCGA, The Cancer Genome Atlas. *P < 0.05, **P < 0.01, ***P < 0.001.
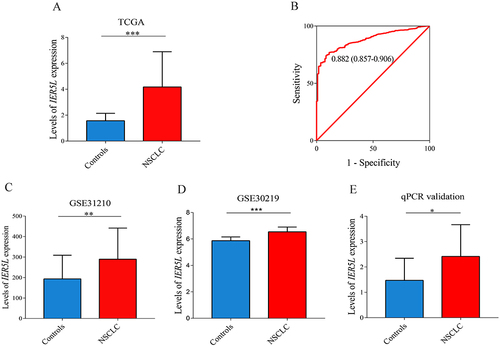
Figure 5 Single cell-RNA sequencing analysis in NSCLC. (A) A heatmap of six datasets. (B-E) Single-cell atlas and violin plot of IER5L in NSCLC_GSE117570, NSCLC_GSE127465, NSCLC_GSE139555, and NSCLC_GSE99254.
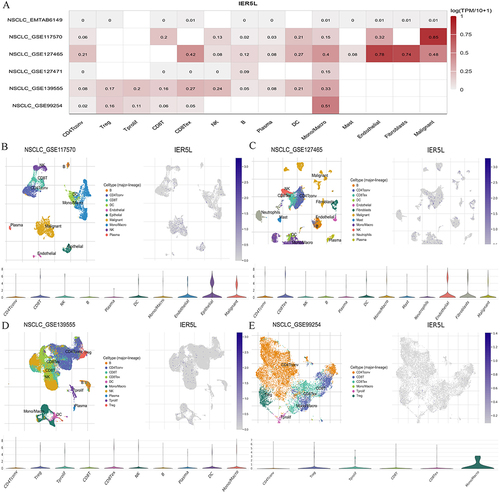
Figure 6 The clinical value of IER5L in NSCLC. (A-C) OS probability in the TCGA, GSE31210, and GSE30219. (D) DFS probability in the GSE30219. (E-G) Levels of IER5L expression in different UICC stages in TCGA, GSE31210, and GSE30219. (H) Levels of IER5L expression in different relapse groups in GSE30219. *P < 0.05, **P < 0.01.
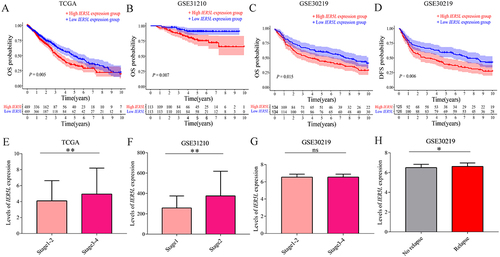
Figure 7 Univariate and multivariate Cox regression analysis, and a nomogram and its calibration plots. Univariate and multivariate Cox regression analyses in NSCLC in (A and B) TCGA, (C and D) GSE30219, and (E and F) GSE31210. (G) Nomogram. (H) Calibration plots of the nomogram. **P < 0.01, ***P < 0.001.
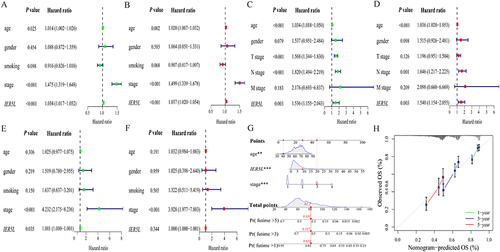
Figure 8 Methylation and mutation analysis. (A) Correlation of IER5L expression with IER5L methylation. (B, C) Gene mutation frequencies in the high and low IER5L expression groups in lung adenocarcinoma. (D and E) Gene mutation frequencies in the high and low IER5L expression groups in lung squamous cell carcinoma. (F) Correlation of IER5L expression with TMB.
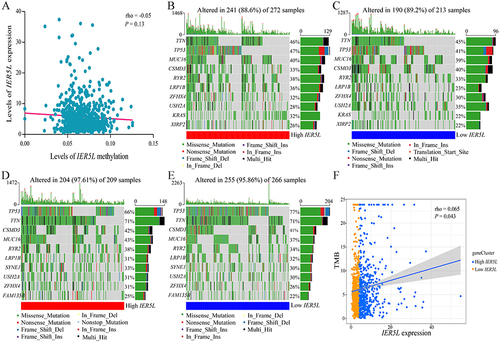
Figure 9 A miRNA-transcription factor-mRNA network. (A) Overlapping transcription factors between Harmonizome and GRNdb databases. (B) Levels of EGR1 relative expression in NSCLC. (C) Overlapping microRNAs among miRWalk, TargetScan, and mirDIP databases. (D) An EGR1-hsa-miR-8075-IER5L network.
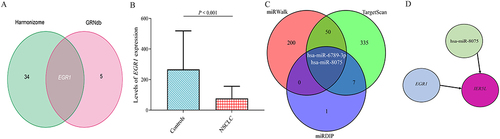
Figure 10 A PPI network, functional enrichment analysis, and gene set enrichment analysis. (A) A heatmap of two IER5L expression groups. (B) A PPI network. (C) Functional enrichment analysis, including BP, CC, and MF. (D) Cell cycle. (E) DNA replication. (F) Notch signaling pathway, (G) Oxidative phosphorylation. (H) Base excision repair. (I) Nucleotide excision repair.
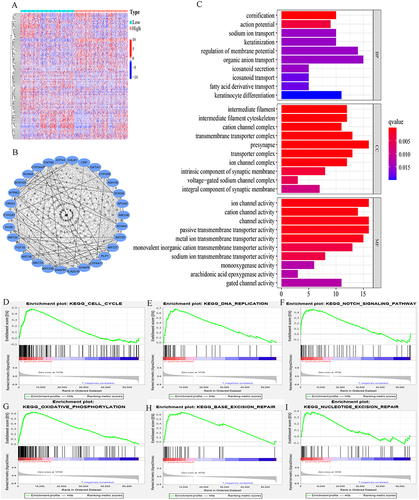
Figure 11 Correlations of IER5L expression with immune infiltration. (A) Immune infiltration profiles between the two IER5L expression groups. Correlations of IER5L expression with (B) Treg cells, (C) activated NK cells, (D) naive B cells, (E) resting memory CD4+ T cells, (F) resting dendritic cells, (G) resting mast cells. *P < 0.05, **P < 0.01, ***P < 0.001.
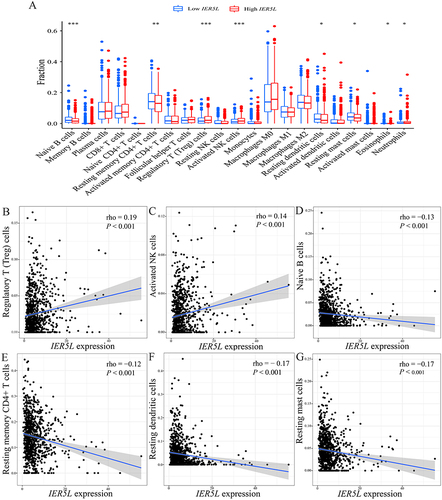
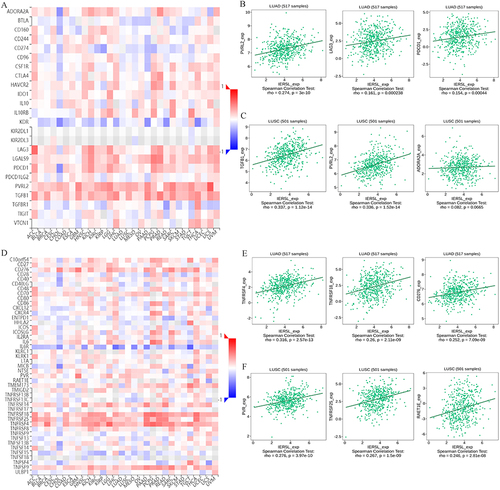
Figure 12 Correlations of IER5L expression with immune molecules. (A) Correlations of IER5L expression with immune inhibitors in multiple cancers. (B and C) The top 3 immune inhibitors in lung adenocarcinoma and lung squamous cell carcinoma. (D) Correlations of IER5L expression with immune stimulators in multiple cancers. (E and F) The top 3 immune stimulators in lung adenocarcinoma and lung squamous cell carcinoma.