
Figures & data
Table 1 Comparison of Baseline Clinical Characteristics Among Three Groups Before and After Propensity Score Matching
Table 2 Comparison of Surgical Procedures Among Three Groups Before and After Propensity Score Matching
Table 3 Comparison of Surgery-Related Complication Among Three Groups Before and After Propensity Score Matching
Table 4 Comparison of Pathological Outcomes Among Three Groups Before and After Propensity Score Matching
Table 5 Comparison of Pathological Outcomes Between the NCT Group and NCT Group Before and After Propensity Score
Figure 1 Unmatched Kaplan-Meier survival analysis of DFS (A) and OS (B) among NCT, NCRT and S+CRT groups. Propensity-matched Kaplan-Meier survival analysis of DFS (C) and OS (D) among NCT, NCRT and S+CRT groups.
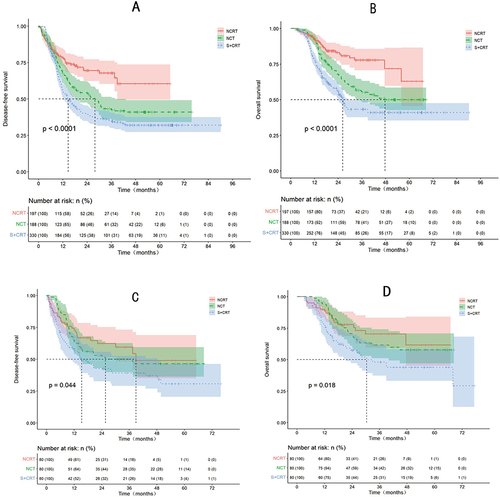
Table 6 Multivariate Analyses of Prognostic Factors Related to OS and DFS Before Propensity Score
Data Sharing Statement
The supporting data for this study can be procured from the corresponding author, provided a reasonable request is made.