Figures & data
Figure 1 Study flowchart.
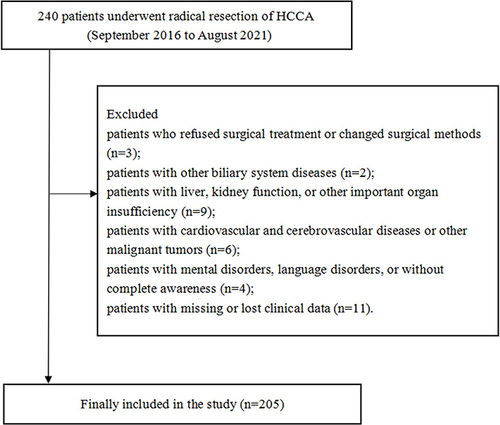
Table 1 Comparison of Perioperative SAS Score and SDS Score in Patients (Mean ± SD)
Table 2 Comparison of Liver Function and Inflammatory Indexes Between the Two Groups on the Third Day After Operation (Mean±SD)
Table 3 Comparison of Postoperative Complications in Patients with or Without Negative Emotions (n, %)
Table 4 Binary Logistic Regression Analysis of Negative Emotional Risk Factors in Patients
Table 5 Comparison of PS, KPS and QOL Scores Between the Two Groups After Radical Resection of HCCA
Table 6 Univariate Analysis of Postoperative Survival in HCCA Patients n (%)
Table 7 Cox Risk Regression Analysis of Factors Related to Postoperative Survival of Patients
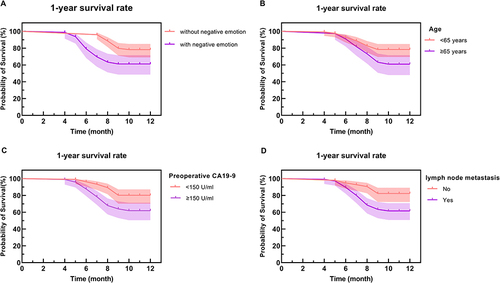
Figure 2 Analysis of the Kaplan-Meier survival curve results. (A) Postoperative survival curves of patients with and without negative emotions; (B) Postoperative survival curves between patients < 65 years old and ≥ 65 years old; (C) Postoperative survival curve of patients with preoperative CA19-9 < 150U/mL and preoperative CA19-9 ≥ 150U/mL; (D) Postoperative survival curve of patients with lymph node metastasis and non-lymph node metastasis.