Figures & data
Table 1 Demographic- and Disease-Related Characteristics of IBD Patients
Figure 1 (a) Percentage relationship between physical activity level, disease type and disease activity level. (b) Fatigue in IBD patients as measured by MFI scales.
Notes: The median is represented by the solid line, while the interquartile range is shown by the dotted line. The scores of the five subscales of the Multidimensional Fatigue Inventory (overall fatigue, physical weariness, reduced activity, reduced motivation, and mental fatigue) in patients with IBD are shown in the little insert inside the graphs (b).
Abbreviations: L, Low physical activity; M, Moderate physical activity; H, High physical activity.
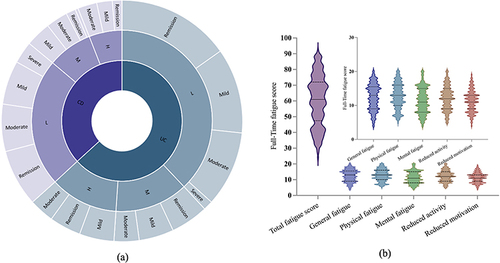
Figure 2 (a) Fatigue scores of people with different physical activity levels. (b) Outcome scores for people with different physical activity levels.
Notes: (a) The full-time fatigue score is measured by MFI scales. Scatter representation of the distribution of the data. The p-values were calculated by the LSD test for independent samples, Bonferroni correction. (**p < 0.001; ns: non-significant). (b) Data are presented as median and range. Parametric and non-parametric tests are selected based on whether the data are homogeneous in variance and whether they conform to a normal distribution. (**p < 0.001; *p < 0.05).
Abbreviations: L, Low physical activity; M, Moderate physical activity; H, High physical activity.
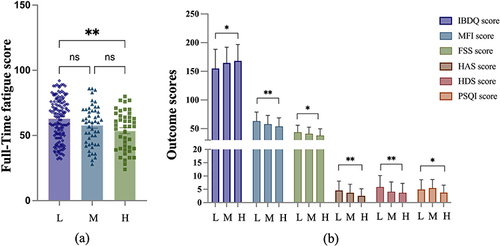
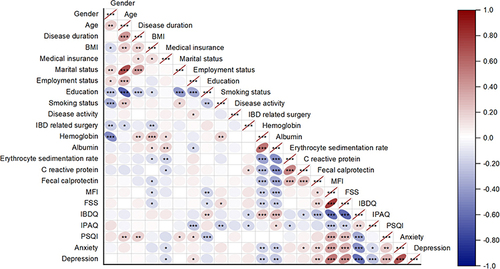
Figure 3 Correlation analysis of 23 factors.
Notes: Some factors have a negative correlation, represented by the color blue, while others have a positive correlation, represented by the color red. The greater the relevance, the darker the color. The greater the relevance, the greater the inclination. (*p < 0.05, **p < 0.01, ***p < 0.001).