Figures & data
Figure 1 High expression of TEAD4 in HCC.
Notes: (A) The mRNA expression levels of TEAD4 in tumors (n=371) and normal (n=50) from TCGA. ***p<0.001. (B) The mRNA expression levels of TEAD4 in different genders. ***p<0.001. (C) The mRNA expression levels of TEAD4 in different nodal metastasis status. ***p<0.001. (D) The mRNA expression levels of TEAD4 in different tumor grades. ***p<0.001. (E) The mRNA expression levels of TEAD4 in different cancer stages. ***p<0.001. (F) The normalized mRNA expression levels of TEAD4 in tumors and normal from TCGA. ***p<0.001. (G) The protein levels of TEAD4 in tumors and normal from TCGA.
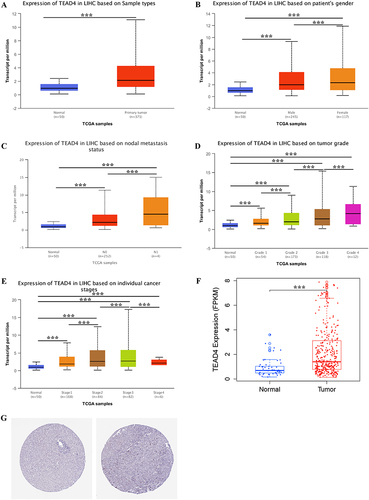
Figure 2 Correlation between TEAD4 and clinical characteristics in poor HCC patients.
Notes: (A–E) The total, 1 years, 2 years, 3 years, and 5 years overall survival curves of high and low expression of TEAD4 in HCC. (F and G) The overall survival curves of high and low expression of TEAD4 in female and male HCC patients. (H and I) The overall survival curves of high and low expression of TEAD4 in hepatitis virus infected or uninfected HCC patients. (J and K) The overall survival curves of high and low expression of TEAD4 in drinking and not drinking HCC patients.
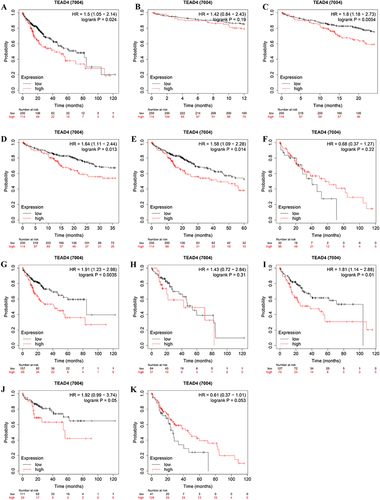
Figure 3 TEAD4 in HCC patients.
Notes: The expression of TEAD4 in liver cancer tissue was significantly higher than that in normal liver tissue. The expression of TEAD4 in early relapsed liver cancer tissues was significantly higher than that in non-relapsed patients. (A) Normal liver tissue from a patient with hepatic hemangioma; (B) Liver cancer tissue from a patient with hepatocellular carcinoma that had not recurred within 3 years; (C) Liver cancer tissue from a patient with hepatocellular carcinoma that recurred within 1 year.
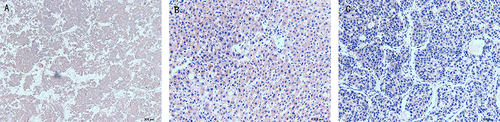
Figure 4 The knock down of TEAD4 in HepG2.
Notes: The results suggested that TEAD4 was inhibited in HepG2 after transfer and siRNA3 was the most significant.
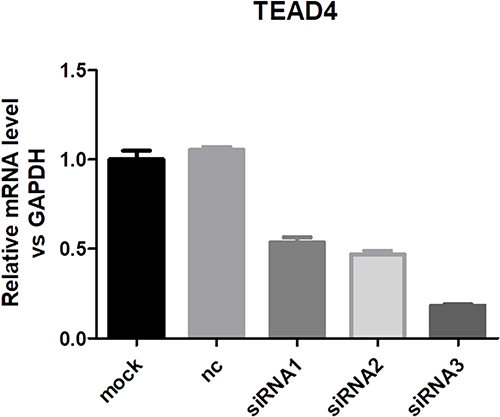
Figure 5 MTT assay was used to detect the proliferation of HepG2 with the knock down of TEAD4.
Notes: Detection time point: 24,48,72 hr after siRNA transfection, p<0.001, siTEAD4 HepG2 vs normal HepG2. siTEAD4: TEAD4 were knocked down in HepG2 cells. NC siTEAD4: TEAD4 were not knocked down in HepG2 cells.
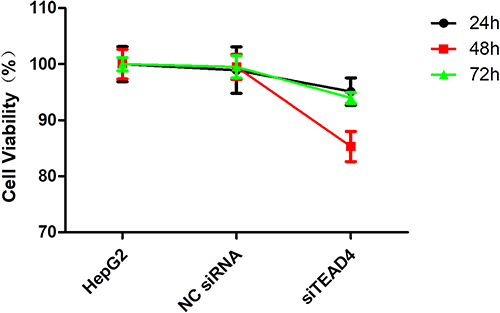
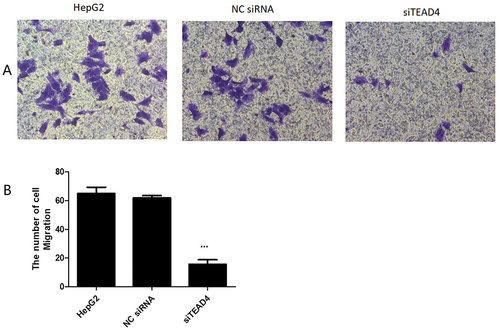
Figure 6 Transwell assay detected the invasive effect of TEAD4 gene on HepG2 cells.
Notes: (A) Transwell assay detected the effect of TEAD4 on cell proliferation. Compared with normal HepG2 group and non-TEAD4-knockdown HepG2 control group, HepG2 cell migration with TEAD4 knockdown was significantly reduced. (B) The light absorption of crystal violet eluent at OD 570 NNL was measured. The absorbance value could indirectly reflect the number of cells. Compared with normal HepG2 group and non-TEAD4-knockdown HepG2 control group, hepG2 cells in TEAD4 knocked down group were significantly reduced. ***p<0.001, siTEAD4 HepG2 vs normal HepG2. siTEAD4: TEAD4 were knocked down in HepG2 cells. NC siTEAD4: TEAD4 were not knocked down in HepG2 cells.