
Figures & data
Figure 1 NUP107 is overexpressed in LUAD and is a meaningful diagnostic factor. (A) Differential expression of NUP107 in tumor and normal groups in multiple cancers in the TCGA database. (B-E) Comparison of NUP107 expression levels between tumor and normal groups in TCGA dataset and 3 GEO validation datasets (GSE10072, GSE27262, GSE30219). (F-I) Diagnostic ROC curve of NUP107 in TCGA dataset and 3 GEO validation datasets (GSE10072, GSE27262, GSE30219). *p < 0.05; ***p < 0.001.
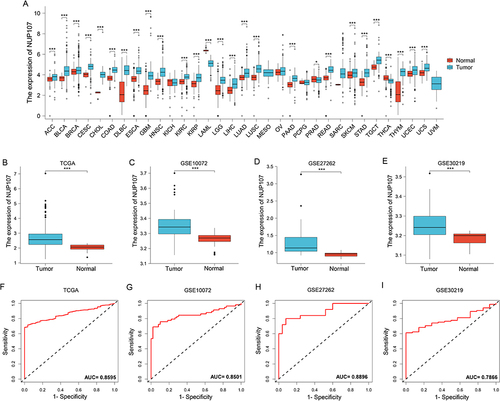
Figure 2 Overexpression of NUP107 is related to poor prognosis. (A and B) Kaplan-Meier (KM) survival analysis of NUP107 in TCGA dataset and GSE30219 dataset. (C) KM survival curve of NUP107 from the GEPIA database. (D) COX univariate analysis of clinical characteristics in LUAD. (E) COX multivariate analysis of meaningful clinical characteristics.
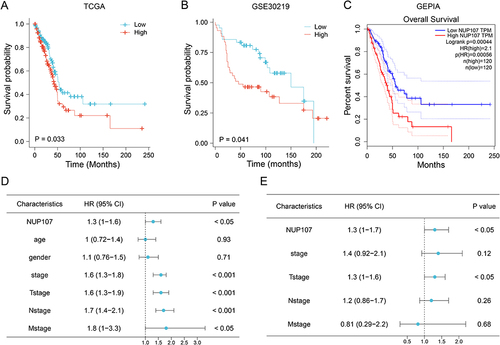
Figure 3 DEGs and function analysis of NUP107. (A) A volcanic map composed of meaningful DEGs in the TCGA dataset. (B) The dot plot displayed the outcomes of GO analysis. (C) The dot plot displayed the outcomes of KEGG analysis. The degree of gene enrichment and significance in the dot plot were indicated by dot size and color, respectively. (D) Demonstration of the outcomes of GSEA analysis.
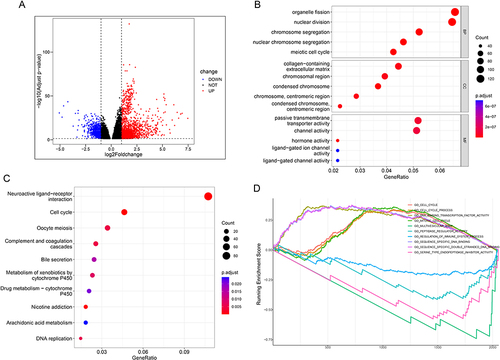
Figure 4 Screening of hub genes in LUAD. (A) Based on different soft thresholds (powers), the scale-free fitting index was calculated, and the analysis of mean connectivity was carried out. (B) Gene dendrogram of LUAD cases for clustering. (C) The composite diagram showed the clustering of tumor cases and the relevance between LUAD samples and clinical parameters. (D) Heatmap showing correlations between modules and clinical phenotypes. (E) Scatter plot showing genes in the key module (turquoise module). (F) PPI networks of genes with MM and GS greater than 0.65 in turquoise modules.
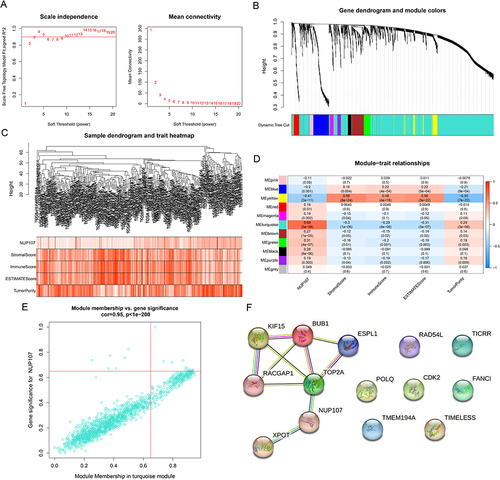
Figure 5 Value of hub gene in diagnosis and prognosis of LUAD. (A–E) Differential expression of hub genes between tumor and normal groups. (F-J) Diagnostic ROC curve of hub genes identifying LUAD from normal tissue. (K–O) KM curves from survival analysis of hub genes. The comparisons were performed between two groups with different expression. (P–S) Immunohistochemical images of TOP2A, ESPL1, KIF15, RACGAP1 from the HPA database. The contrast was made by immunohistochemical staining between LUAD and lung tissue. ***p < 0.001.
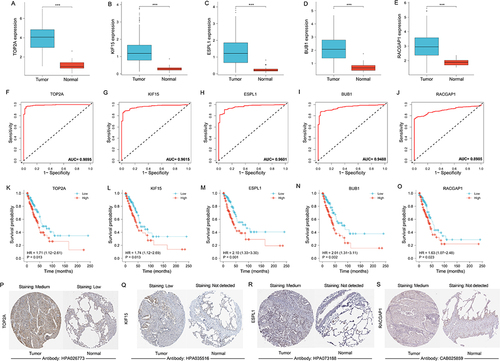
Figure 6 Exploration of upstream genes for NUP107 in LUAD. (A) Correlation analysis of NUP107 with predicted miRNA (hsa-miR-140-3p). (B–F) Correlation analysis of hsa-miR-140-3p with 5 predicted lncRNAs (LRRC75A−AS1, UBA6−AS1, AL024508.2, AC008014.1, SNHG1). (G) CeRNA network of NUP107. (H) Comparison of hsa-miR-140-3p expression between tumor and normal groups. (I) KM survival analysis of hsa-miR-140-3p in LUAD cases. (J) Comparison of AL024508.2 expression levels between tumor and normal groups. (K) KM survival analysis of AL024508.2 in LUAD cases. ***p < 0.001.
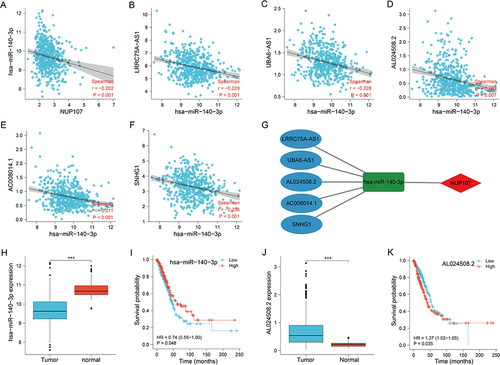
Figure 7 Immune relation analysis in LUAD. (A) Comparison of immune infiltration levels between different CNV types of NUP107 in LUAD. (B) Differences in the expression of immune cells in LUAD cases with different NUP107 expression. (C–F) Comparison of the ESTIMATE score, immune score, stromal score, and tumor purity between two groups with different NUP107 expression. ns, No significance; *p < 0.05; **p < 0.01; ***p < 0.001.
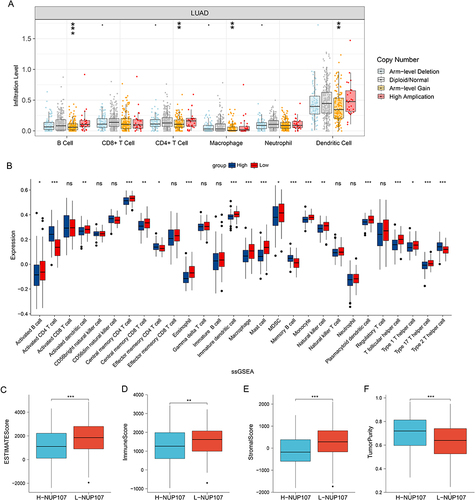
Figure 8 Exploration of the relationship between immunotherapy and NUP107 through TMB and immune checkpoint. (A) The gene mutation maps of high NUP107 expression group in LUAD. (B) The gene mutation maps of low NUP107 expression group. (C) Comparison of TMB between different NUP107 expression groups. (D) Comparison of immune checkpoint expression between different NUP107 expression groups. *p < 0.05; **p < 0.01; ***p < 0.001.
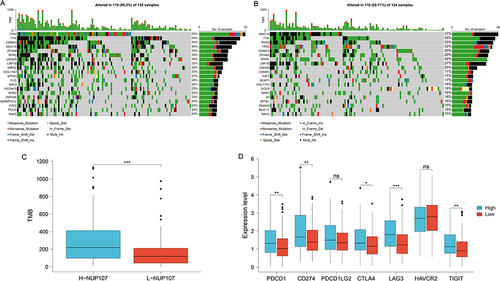
Figure 9 Identification of cell types and comparison of NUP107 expression. (A) UMAP map of dimensionality reduction and cell clustering in the GSE198291 dataset. (B) UMAP map of NUP107 expression in various cell clusters from the GSE198291 dataset. (C) UMAP map of dimensionality reduction and cell clustering in the GSE171145 dataset. (D) UMAP map of NUP107 expression in various cell clusters from the GSE171145 dataset. (E and F) Differences in NUP107 expression among different cell clusters in the GSE198291 and GSE171145 datasets.
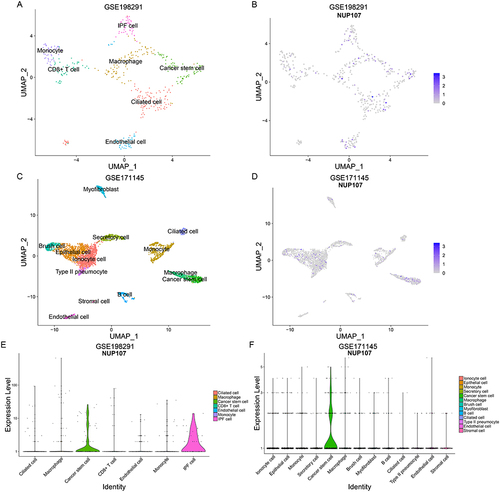
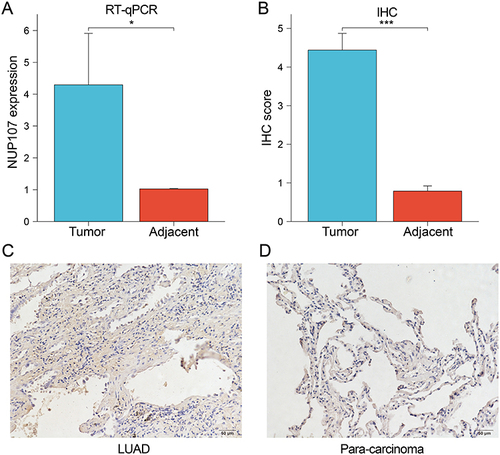
Figure 10 (A) The expression levels of NUP107 were compared in the tumor versus the adjacent lung tissues by RT-qPCR. (B) Comparison of IHC scores between LUAD tissue and adjacent lung tissue. (C and D) Immunohistochemical images of tumor tissue and adjacent lung tissue from a LUAD patient. *p < 0.05; ***p < 0.001.
Data Sharing Statement
The original data for this paper can be found in the UCSC Xena (xenabrowser.net), GEO database (https://www.ncbi.nlm.nih.gov/geo/), Genomic Data Commons (https://portal.gdc.cancer.gov/), miRbase (https://www.mirbase.org/). Relevant data for this study are also available upon request from the corresponding author.