
Figures & data
Figure 1 Differential gene screening. (a) Heatmap of DEGs in GSE6710. (b) Heatmap of DEGs in GSE30999. (c) Volcano plot of DEGs in GSE6710. (d) Volcano plot of DEGs in GSE30999. Number of DEGs in (e) GSE6710 and (f) GSE30999. (g) Venn diagram of common DEGs in GSE6710 and GSE30999.
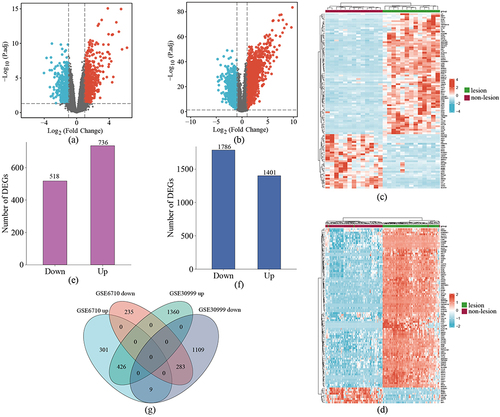
Figure 2 GO and KEGG pathway enrichment analysis of DEGs. (a–c) Bubble charts show GO-enriched items of DEGs in BP, CC, and MF. (d) The circle plot shows KEGG-enriched items of DEGs. The red and the blue dots of the outer ring represent upregulated and downregulated genes, respectively. The height of the bar in the inner ring describes the adjusted p-value and the color corresponds to the z-score. (e) Chord plots show GO-enriched items of the overlapping DEGs.
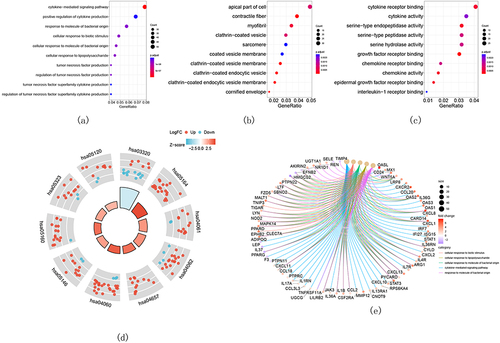
Figure 3 Results of screening of critical signatures by using RF, LASSO, and SVM-RFE algorithms. (a–c) Identification of signatures using RF. Variant of mean out-of-band error rate with (a) mtry and (b) trees. (c) The out-of-band error is used to compute the variable importance, which is represented by the mean decline in accuracy (left panel) or the Gini coefficient (right panel). (d, e) LASSO was used to establish signatures. (d) Logistic regression analysis where different genes were represented with different colors. (e) Choosing the ideal parameter (lambda) for the LASSO model (left dash line). (f) Variant of 10-fold cross-validation error with the indicated number of signatures.
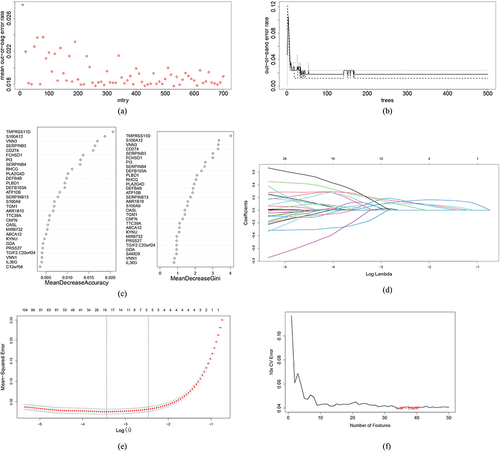
Figure 4 Results of screening of critical signatures using WGCNA. (a and b) Analysis of network topology for various soft-powers. By setting threshold = 0.9, soft-power = 17 was selected as the best parameter. (c and d) DEGs associated with psoriasis in a Clustering dendrogram, with differences based on topological overlap and given module colors (c). Module-trait relationships (d). Each module is represented by a row and each trait by a column. The matching correlation and p-value are included in each cell. According to the color legend, the table is color-coded based on association. (e) Venn diagrams showing the intersection of critical signatures obtained from these four machine learning algorithms.
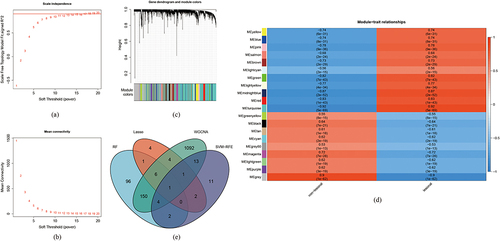
Figure 5 Verification of ADAM23 as a diagnostic shared gene. (a) Diagnostic power of ADAM23 in GSE41662. Expression of ADAM23 in the (b) GSE6710, (c) GSE30999, and (d) GSE41662 datasets.
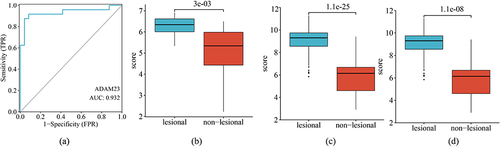
Figure 6 Immune infiltration analysis of ADAM23. (a) PCA cluster plot of gene expression profiles of psoriasis and control samples in GSE30999. (b) Boxplot of 22 types of immune cells in the GSE6710 dataset. *** p < 0.001, ** p < 0.01, * p < 0.05; not significant (ns) p ≥ 0.05. (c) Bar plot showing immune cell infiltration in GSE30999. (d) Correlations between ADAM23 and infiltrating immune cells in GSE30999. (e) Correlations between ADAM23 and infiltrating immune cells in GSE30999.
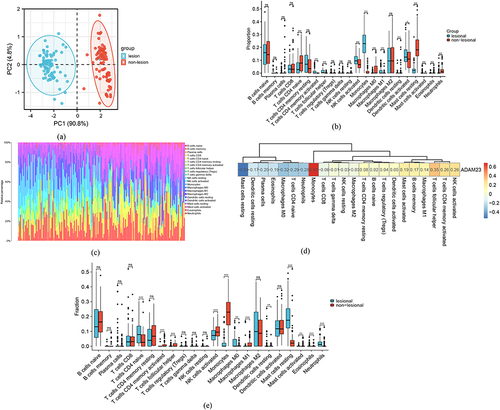
Figure 7 Upregulation of ADAM23 in mice psoriasis tissues. (a and b) Establishment of a mouse model of psoriasis. (c) H&E staining of skin from healthy mice and skin lesions from psoriatic mice. (d and e) Protein levels of ADAM23 in mice psoriasis lesion samples assessed by Western blot analysis.
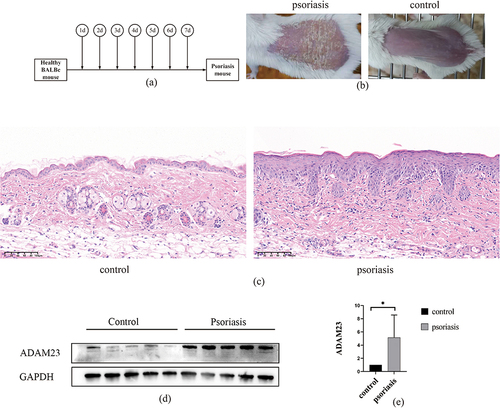
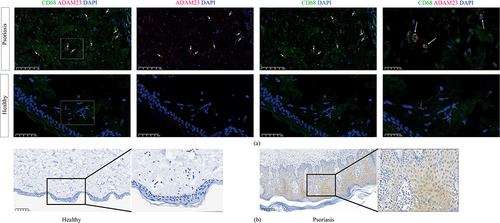
Figure 8 Immunohistochemistry and immunofluorescence showed that ADAM23 was elevated in psoriasis lesion skins. (a) Immunofluorescence for ADAM23 and CD68 in psoriasis tissues from human psoriasis lesion samples and healthy skin samples. (b) Immunohistochemistry for ADAM23 in psoriasis lesion skins and healthy skin tissues.
Data Sharing Statement
The datasets generated during and/or analyzed during the current study are publicly available.