Figures & data
Table 1 Clinicopathological Characteristics of EC Patients and Controls
Table 2 Relationships Between circEPSTI1 Expression Levels and Patient Clinicopathological Characteristics
Table 3 Univariate and Multivariate Cox Analyses of PFS-Related Factors in EC Patients
Table 4 Univariate and Multivariate Cox Analyses of OS-Related Factors in EC Patients
Figure 1 Patients with EC exhibit elevated serum levels of circEPSTI1. (A) The genomic loci of circEPSTI1 and the Sanger sequence of junction site of circEPSTI1. (B) Serum samples from EC patients and healthy subjects were assessed to compare serum circEPSTI1 expression, which was found to be elevated in individuals diagnosed with EC. ***P<0.001.
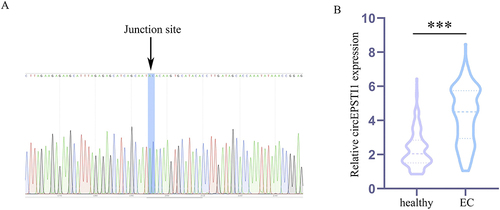
Figure 2 Serum levels of circEPSTI1 are related to the clinicopathological characteristics of patients with EC. Log rank tests were utilized to assess the PFS (A) and OS (B) of patients exhibiting low or high circEPSTI1 expression.
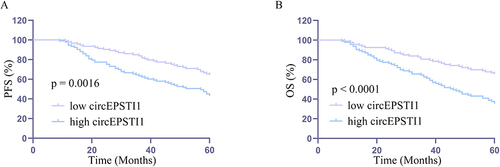
Figure 3 Evaluation of the expression and diagnostic value of MIF in patients with EC. (A) Serum MIF concentrations were elevated in EC patients as compared to healthy subjects. (B) Serum MIF concentrations were able to distinguish between EC patients and control subjects in ROC curve analyses. ***P<0.001.
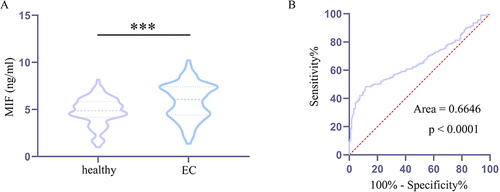
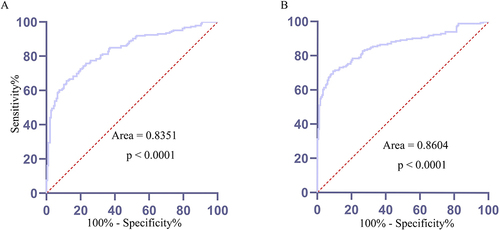
Figure 4 Serum circEPSTI1 offers diagnostic value for the detection of EC. (A) Serum levels of circEPSTI1 were able to effectively distinguish between EC patients and controls when constructing an ROC curve. (B) An ROC curve analysis was conducted for the combination of circEPSTI1 and MIF to more effectively distinguish between healthy subjects and individuals with EC.