Figures & data
Figure 1 Lnc-SNHG5 is up-regulated in HCC. (A) TIMER database showed the expression of lnc-SNHG5 in the indicated cancers. (B) UALCAN showed the expression of lnc-SNHG5 in the indicated cancers. (C) TCGA showed the expression of lnc-SNHG5 in liver cancer. (D) qPCR showed the expression of lnc-SNHG5 in HCC tissues and the normal tissues. (E) qPCR showed the expression of lnc-SNHG5 in the indicated cell lines. Data are presented as the mean±standard deviation. Statistical differences were analyzed using the independent samples t-test. *P<0.05; **P<0.01; ***P<0.001.
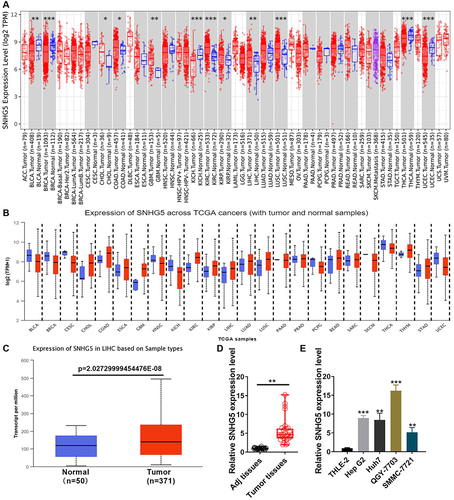
Figure 2 Lnc-SNHG5 is positively related to tumor grade of HCC patients. (A) TCGA showed the expression of lnc-SNHG5 in different ages in HCC patients. (B) TCGA showed the expression of lnc-SNHG5 in Male and Female in HCC patients. (C) TCGA showed the expression of lnc-SNHG5 in different weights in HCC patients. (D) TCGA showed the expression of lnc-SNHG5 in different subtypes in HCC patients. (E) TCGA showed the expression of lnc-SNHG5 in individual cancer stages in HCC patients. (F) TCGA showed the expression of lnc-SNHG5 in different tumor grades in HCC patients. (G) Kaplan-Meier plots showed high lnc-SNHG5 levels predicted the poor prognosis in HCC. *P<0.05.
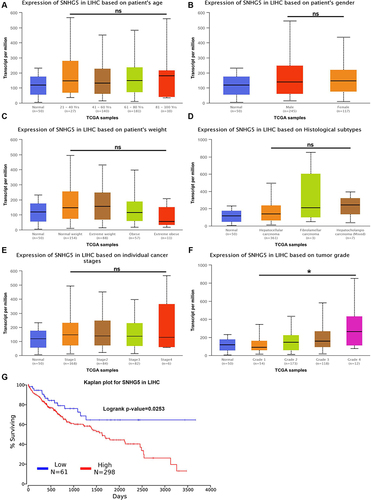
Figure 3 LnCeVar database showed the different cancer hallmark of lnc-SNHG5 involved. (A) GO analysis showed the different cell process of lnc-SNHG5 involved. (B) KEGG analysis showed the different pathways of lnc-SNHG5 involved. (C) The related cancer hallmarks of lnc-SNHG5.
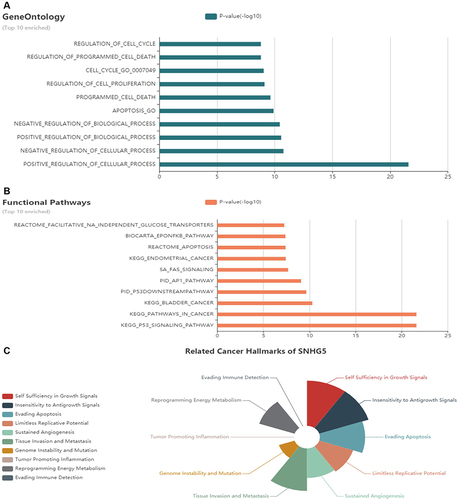
Figure 4 Lnc-SNHG5 promoted cell proliferation. (A) The efficiency of lnc-SNHG5 or shR-SNHG5 was detected by qPCR assay in SMMC-7721 and QGY-7703 cells. (B) The role of altered lnc-SNHG5 expression on cellular viabilities of SMMC-7721 and QGY-7703 cells were detected by CCK8 assay. (C) Colony formation assay showed the proliferation ability in SMMC-7721 and QGY-7703 cells. (D and E) Flow cytometric assay showed the cell apoptosis ability in SMMC-7721 and QGY-7703 cells. Data are presented as the mean±standard deviation. Statistical differences were analyzed using the independent samples t-test. *P<0.05; ***P<0.001.
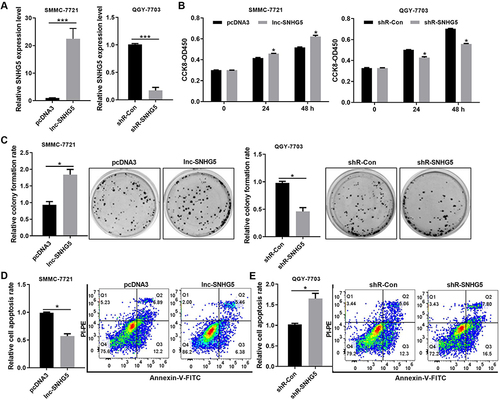
Figure 5 The interaction between Lnc-SNHG5 and RPS3. (A and B) LNCipedia showed the interaction of lnc-SNHG5 and the indicated proteins. (C) The positive expressive correlation of SNHG5 and RPS3 in LIHC.
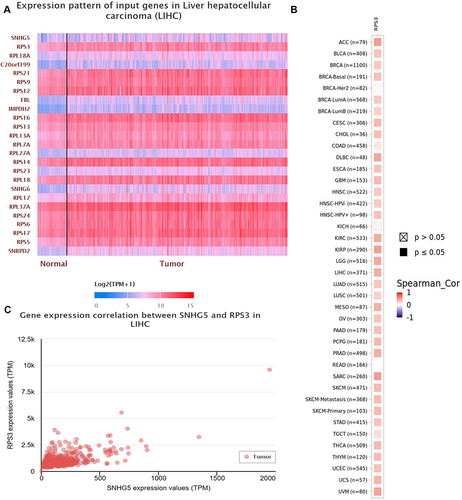
Figure 6 The interactive sites of lnc-SNHg5 and RPS3. (A) IntaRNA database showed the interactive sites of lnc-SNHG5 and RPS3. (B) The interactive landscape of lnc-SNHG5 and RPS3. (C) qPCR showed the mRNA level of RPS3 in SMMC-7721 and QGY-7703 cells. (D) Western blot showed the protein level of RPS3 in SMMC-7721 and QGY-7703 cells. Data are presented as the mean±standard deviation. Statistical differences were analyzed using the independent samples t-test. *P<0.05; **P<0.01.
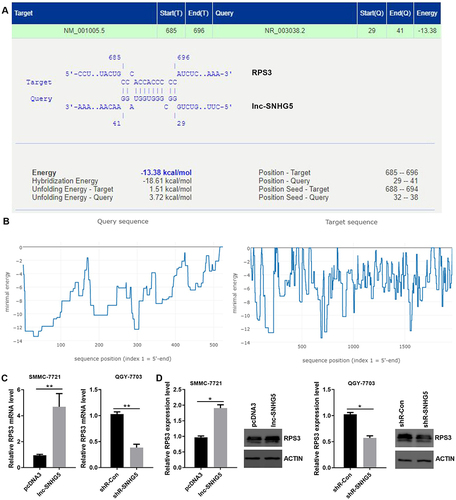
Figure 7 Up-regulated RPS3 in HCC was positively related to tumor grade. (A) TCGA showed the expression of lnc-SNHG5 in liver cancer tissues and the adjacent normal tissues. (B) TCGA showed the expression of RPS3 in different ages in HCC patients. (C) TCGA showed the expression of RPS3 in Male and Female in HCC patients. (D) TCGA showed the expression of lnc-SNHG5 in different weights in HCC patients. (E) TCGA showed the expression of RPS3 in different tumor grades in HCC patients. (F) Kaplan-Meier survival analysis showed high levels of RPS3 predicted poor prognosis in HCC. (G) IHC showed the RPS3 expression level in HCC tissues. (H) Western blot showed the RPS3 expression level in cell lines. *P<0.05; **P<0.01; ***P<0.001.
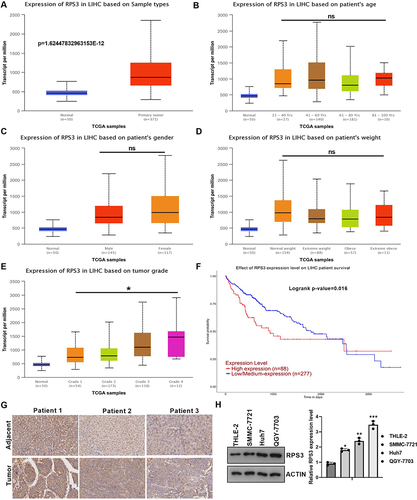
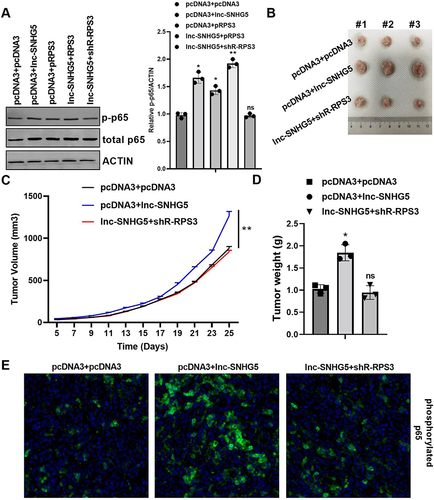
Figure 8 SNHG5 regulated the NF-κB pathway through RPS3 in vitro and in vivo. (A) Western blot showed the total and phosphorylated p65 protein level in SMMC-7721 cells. (B–D) lnc-SNHG5 promoted and shR-RPS3 inhibited tumor size, tumor growth rate and tumor weight. (E) IF showed the protein expression of phosphorylated p65 in tumor tissues. Data are presented as the mean±standard deviation. Statistical differences were analyzed using the independent samples t-test. *P<0.05; **P<0.01.