Figures & data
Figure 1 The diagram of the study. The sample used for analysis and the analysis diagram of the study.
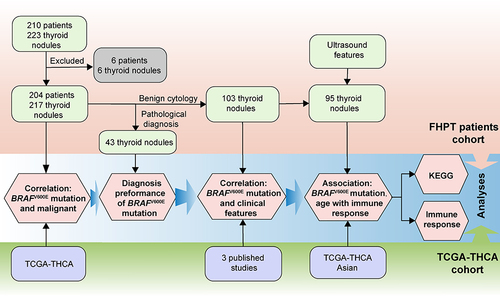
Table 1 Correlation Between Clinical Characteristics and BRAF600E Mutation in All Thyroid Nodules
Figure 2 Associations of BRAFV600E mutation with thyroid nodule classifications and clinicopathological stages. (A) Alluvial diagram of the BRAFV600E mutation with different classification of US classification C-TIRADS, TBSRTC categories, and Pathological diagnosis; (B–E) Correlation between BRAFV600E mutation status and (B) tumor stages, (C) T stages, (D) N stages, (E) M stages in TCGA-THCA cohort, red: positive BRAFV600E mutation, blue: negative BRAFV600E mutation; (F) The correlation between BRAFV600E mutation status and the expression of BRAF in TCGA-THCA cohort.
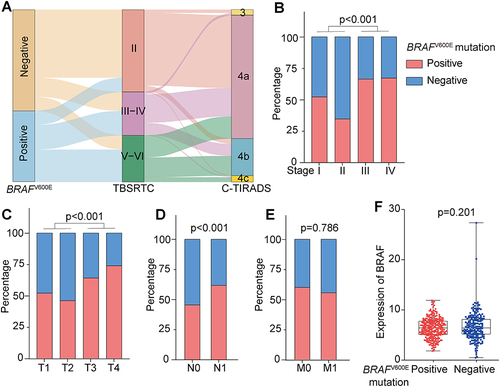
Table 2 Clinical Characteristics Associated with Malignant in Thyroid Nodules
Table 3 Diagnostic Efficacy of Different Methods for Discrimination Malignant in Thyroid Nodules
Table 4 Correlations of BSRTC Categories with BRAFV600E Mutation and Pathological Results
Table 5 The Prediction of BRAFV600E Mutation on Malignancy in Thyroid Nodules with Benign Cytology
Figure 3 ROC analysis of diagnosis methods for malignancy. The ROC analysis of TBSRTC, BRAFV600E mutation status, and C-TIRADS for malignancy in thyroid nodules.
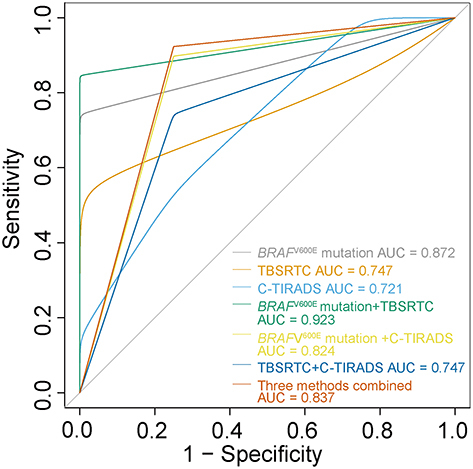
Table 6 Correlation Between BRAFV600E Mutation and Clinical Characteristics in Thyroid Nodules with Benign Cytology
Table 7 The Relationship Between BRAFV600E Mutation and Clinical Characteristics in C-TIRADS 3–4a Patients with Benign Cytology
Figure 4 The correlation of BRAFV600E mutation status and patient age. (A–E) Comparison of patient age between positive and negative BRAFV600E mutation (A) in benign cytology TBSRTC II, (B) in C-TIRADS 3–4a with benign cytology, (C) in all the patients of our cohort, (D) in TCGA-THCA cohort, and (E) in TCGA-THCA-Asian cohort (E). (F) Liner correlation between patient age and BRAFV600E mutation rate in different cohorts. Green: TCGA-THCA Asian cohort, red: FHPT cohort in TBSRTC II, blue: FHPT cohort in C-TIRADS 3–4a with TBSRTC II.
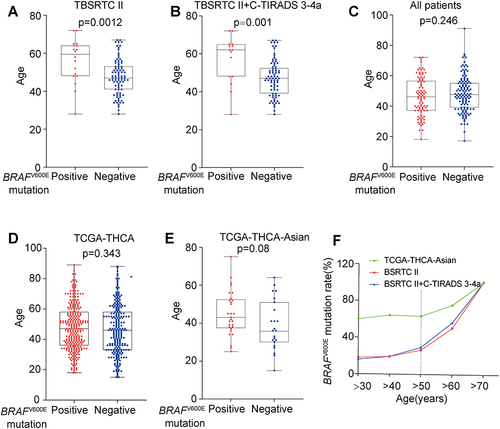
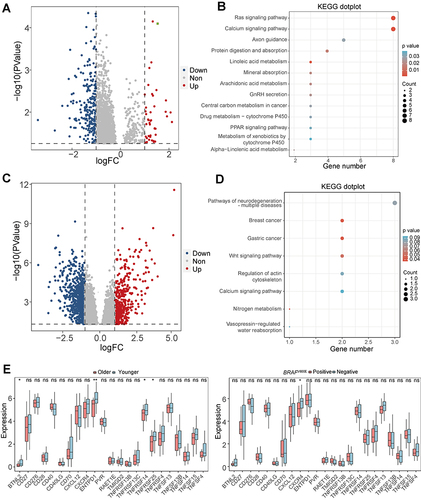
Figure 5 The association in immune response with BRAFV600E and patients age. (A) The volcano plot of differentially expressed genes (DEGs) between older and younger patients in TCGA-THCA-Asian, younger: ≤50 years vs.older: >50 years. (B) KEGG analysis of DEGs between younger and older patients in TCGA-THCA-Asian. (C) The volcano plot of DEGs between patients with positive and negative BRAFV600E mutation in TCGA-THCA-Asian. (D) KEGG analysis intersection DEGs between BRAFV600E mutations groups and age groups. (E) The proportion of immunosimulators in younger and older patients, positive and negative BRAFV600E mutation in TCGA-THCA-Asian. Younger: ≤50 years vs.older: >50 years *p < 0.05, **p < 0.01.