Figures & data
Table 1 Descriptive Statistics for P1, P2, P3, P4, P5 and AI
Table 2 Measurement of Agreement
Figure 1 Digital image of Ki-67 neuroendocrine tumor prepared at 10x was uploaded in the software and the concordance between manual versus automated score was observed.
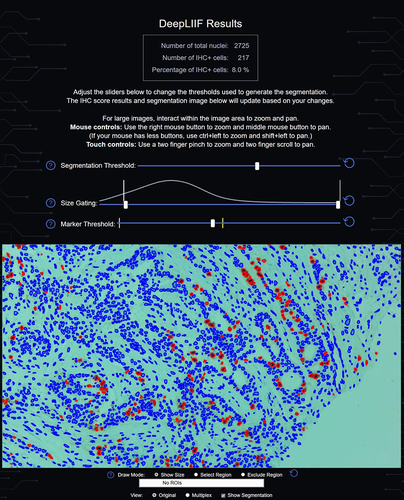
Table 3 Sensitivity, Specificity, PPV, NPV and Diagnostic Accuracy of P2, P3, P4, P5 & AI Using P1 as Gold Standard
Figure 2 Validity by Correlation Matrix showing that the finding of Ki-67 by P1 is strongly positively correlated with P2, P3 and P4 while very highly positively correlated with P5 and AI.
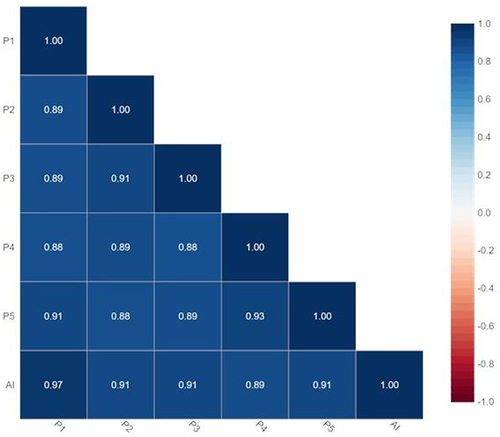
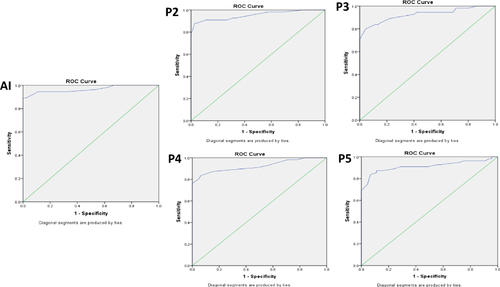
Figure 3 ROC Plots prepared for pathologists P2, P3, P4, P5 and AI to access the quality of test by taking Pathologist P1 score as gold standard.