Figures & data
Table 1 Expression Levels of Serum Cytokines in Patients with Acute Cholecystitis at Different Time Points
Figure 1 The expression levels of serum procalcitonin (PCT) concentrations in patients with acute cholecystitis at different time points. M-C group represents mild acute cholecystitis patients, MS-C group represents moderate-to-severe acute cholecystitis patients. Data are presented as mean ± SD. ***P < 0.001, significantly different from the values in M-C group.
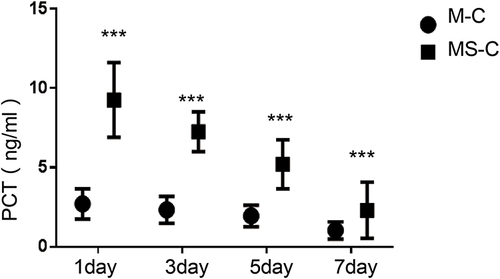
Figure 2 The neutrophil count in the serum of patients with acute cholecystitis at different time points. M-C group represents mild acute cholecystitis patients, MS-C group represents moderate-to-severe acute cholecystitis patients. Data are presented as mean ± SD. **P < 0.01, significantly different from the values in M-C group.
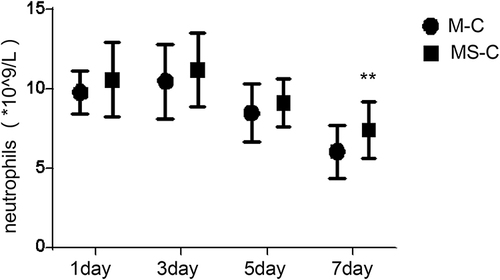
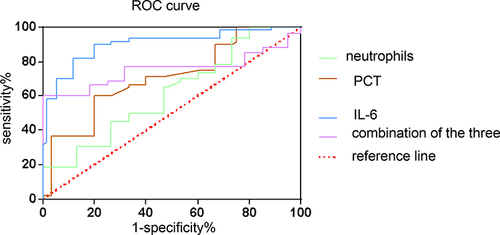
Figure 3 Receiver operating characteristic (ROC) curves analysis of serum IL-6 and PCT levels and neutrophil counts in patients with acute cholecystitis.