Figures & data
Figure 1 Flow chart of patients’ enrollment.
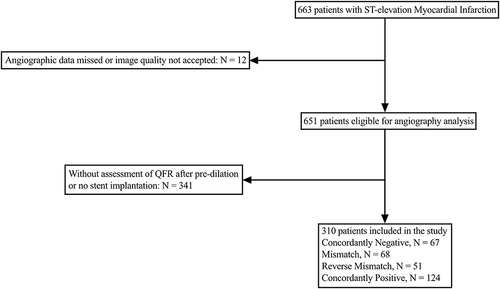
Table 1 Baseline Information
Table 2 Angiographic Results
Figure 2 Comparison of the occurrence of QCA-QFR concordance/discordance after mechanical reperfusion.
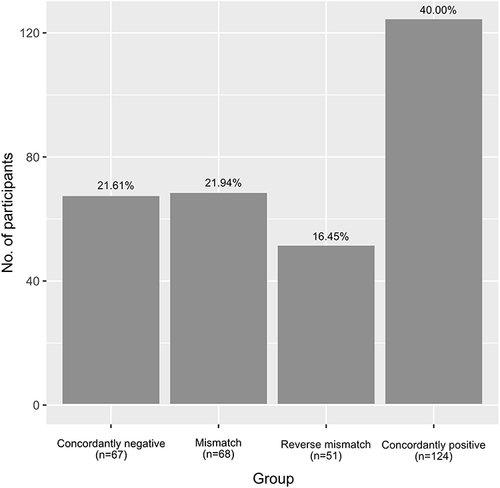
Table 3 Determinants of Reverse Mismatch (QFR ≤ 0.80) in Visually Nonsignificant Lesions (DS ≤ 50%)
Table 4 Determinants of Mismatch (QFR > 0.80) in Visually Significant Lesions (DS > 50%)
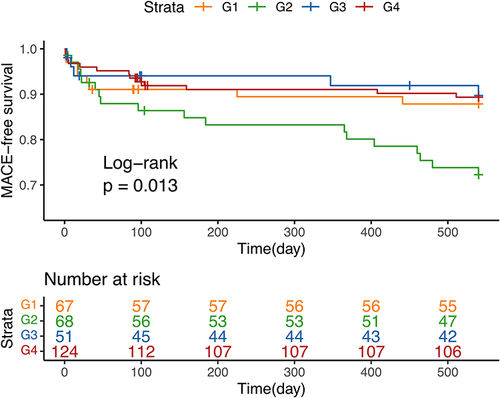
Figure 3 Kaplan–Meier curves for 18-month MACE-free survival between the four groups.
Notes: G1 (Concordantly negative, QCA-DS ≤ 50% and QFR > 0.80), n=67; G2 (Mismatch, QCA-DS > 50% and QFR > 0.80), n=68; G3 (Reverse mismatch, QCA-DS ≤ 50% and QFR ≤ 0.80), n=51; G4 (Concordantly positive, QCA-DS > 50% and QFR ≤ 0.80), n=124.