Figures & data
Table 1 The Demographic and Clinical Characteristics of All Participants
Figure 1 The correlation analysis of plasma SMOC2 between NT-proBNP, LVEDd, EF and length of hospital stay.
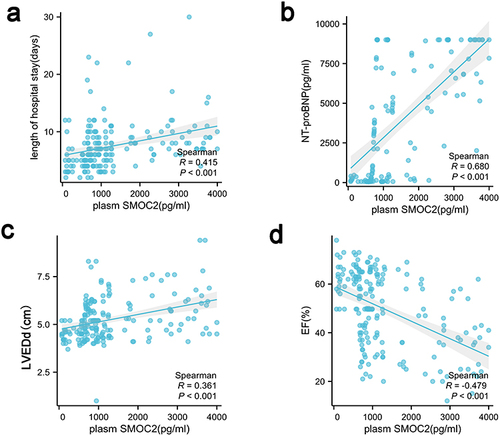
Table 2 The Results of the Univariate Analysis
Table 3 The Results of Multivariate COX Regression Analysis of SMOC2 and Readmission Risk of HF Patients
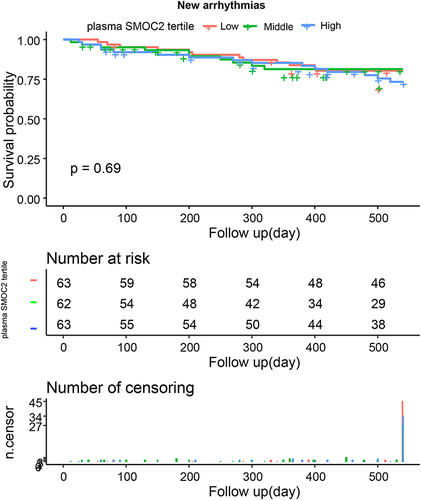
Figure 2 Kaplan–Meier curves demonstrating re-hospitalization stratified by tertiles of SMOC2.
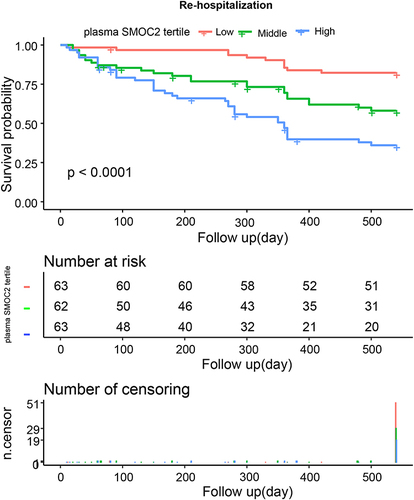
Table 4 The Threshold or Saturation Effect Analysis
Figure 3 The smooth curve fitting analysis of plasma SMOC2 and re-hospitalization.
Notes: Relationship between plasma SMOC2 and re-hospitalization. The red line represents the smooth curve fit between variables. In comparison, blue bands represent the 95% CI. Age, sex, history of smoking, history of AF, NT-proBNP, EF, DBP, HR, heart failure duration, length of hospital stay, NYHA function class, SMOC2, LA, LVEDd, and RA were adjusted.
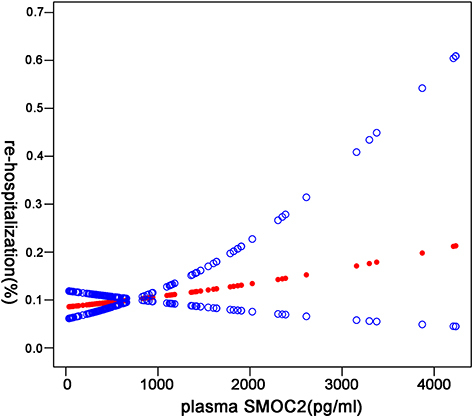
Figure 4 The smooth curve fitting analysis of plasma SMOC2 and all-cause mortality.
Notes: Age, sex, history of smoking, history of AF, NT-proBNP, EF, DBP, HR, heart failure duration, length of hospital stay, NYHA function class, SMOC2, LA, LVEDd, and RA were adjusted.
Figure 5 The smooth curve fitting analysis of plasma SMOC2 and new-onset arrhythmias.
Notes: Age, sex, history of smoking, history of AF, NT-proBNP, EF, DBP, HR, heart failure duration, length of hospital stay, NYHA function class, SMOC2, LA, LVEDd, and RA were adjusted.