Figures & data
Table 1 The Clinical Characteristics of All CH Subjects and JAG1 Variant Carriers
Table 2 Clinical Characteristics of Patients with Potential Pathological Variants
Figure 1 Multiple sequences alignment. Multiple sequences alignment were conducted using ClustalW2 among Homo sapiens, Mus musculus, Rattus norvegicus, Sus scrofa, Pan troglodytes, Bos Taurus, Macaca mulatta and Felis catus. (A) Multiple sequences alignment of JAG1; (B) Multiple sequences alignment of DUOX2; (C) Multiple sequences alignment of DUOXA2. The mutation sites were marked by red arrows.
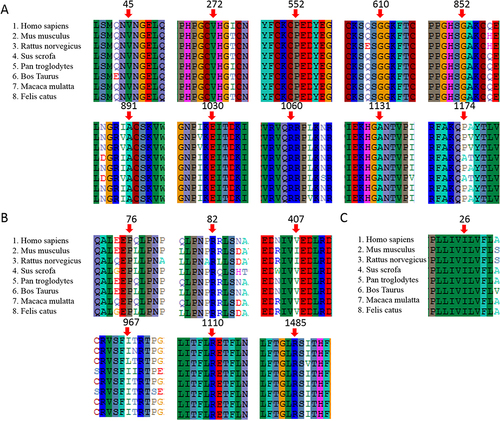
Figure 2 The changes of hydrophobic parameters caused by amino acid substitution. Wild-type amino acids were marked with black, substituted amino acids were marked with red; “+” means increased hydrophobicity, “-” means decreased hydrophobicity.
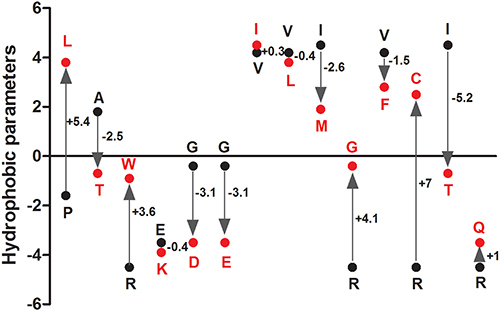
Figure 3 Analysis of genotype and phenotype relationship (A) The distribution of the number of variants carried by each patients; (B) The comparison of fT4 concentration between monogenic group and oligogenic group; (C) The comparison of fT4 concentration between monogenic DH and oligogenic DH; (D) The comparison of fT4 concentration between monogenic TD and monogenic DH. “ns” means P>0.05, “*” means P<0.05.
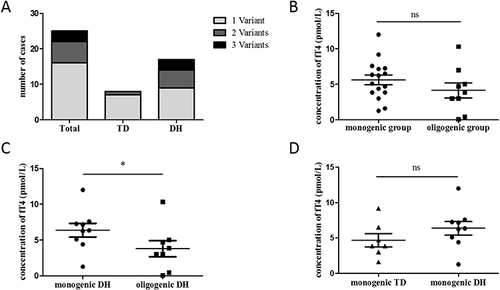
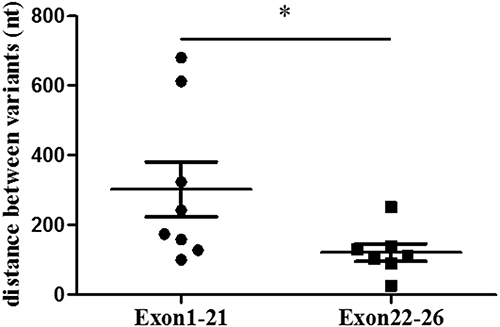
Figure 4 Clustering analysis of JAG1 variants in CH. Distance in nucleotides between missense mutations within exons 1–21 and exons 22–26. Statistical significance was calculated using an unpaired, two-tailed t test, “*” means P<0.05.