
Figures & data
Figure 1 A typical case, a 69-year-old male, had quadriplegia caused by fall and underwent imaging examination 12 hours after injury. (a) The flexion posture of the cervical vertebra depends on raising the head about 15cm. (b) The shoulder is raised about 10cm, and the cervical vertebra is in a hyperextension position. (c) There was no obvious instability in the state of cervical flexion. (d) When the cervical vertebra was overextension, the C3/ 4 was obviously unstable (white arrow).
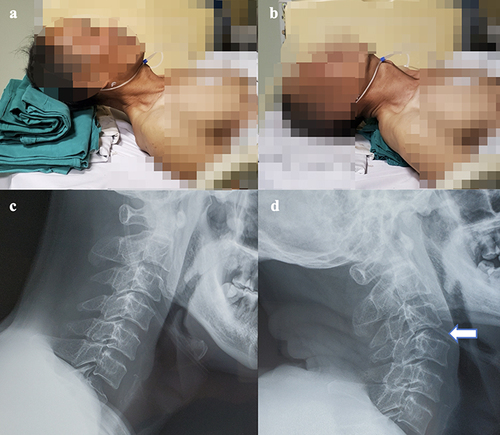
Table 1 Indexes and Observation Methods
Figure 2 (a) Rupture of the anterior longitudinal ligament was shown in the surgical field (blue arrow). (b) No obvious high signal intensity of prevertebral in T2-weighted phase. (c) On T1-weighted phase of MRI, the interruption of prevertebral low signal intensity at C5/6 (white arrow). (d) The CT showed interruption of prevertebral hyperplastic bone (green arrow) at C5/6. (e) The TOPST of C3 and C6 was 0.68cm and 1.48cm (yellow line), the red dot represents the three points of IDA, and the IDA of C5/6 was 28.14 ° (blue line).
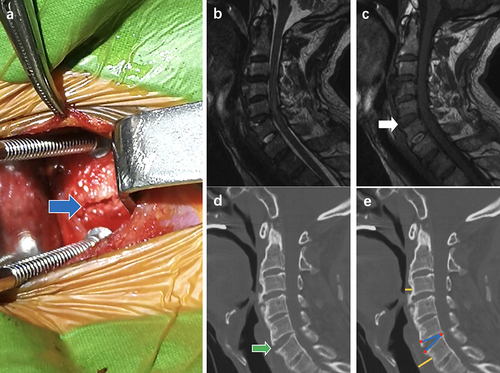
Figure 3 (a) The blue arrow’s place was the ruptured anterior longitudinal ligament. (b) On the T2 weighted phase of MRI, the yellow arrow’s place was T2HS, and the area was 2.686cm ². (c) The low signal intensity of the anterior vertebra was interrupted in the C4/5 segment (white arrow). (d) The thickness of prevertebral soft tissue of C3 and C6 was 0.9 cm and 1.7cm respectively (yellow line). (e) The IDA of C4/ 5 was 32.035° (blue line).
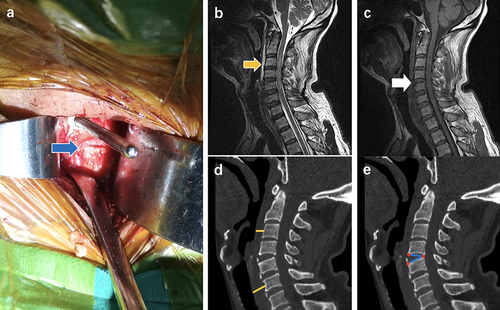
Figure 4 (a) Intraoperative exploration showed ALL damage in C3/4 (blue arrow). (b) the area of T2HS was 6.245cm² (yellow arrow). (c) The prevertebral low signal intensity of the C3/4 segment pointed to by the white arrow was interrupted. (d) The yellow lines represent the thickness of prevertebral soft tissue. The TOPST of C3 and C6 was 0.89 and 1.02cm. (e) The IDA of C3/4 in this patient was 13.814°(blue line).
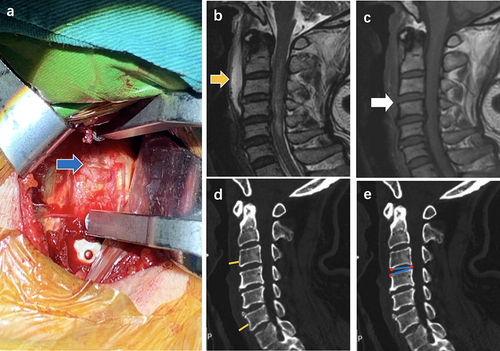
Table 2 Patients: Demographics and Characteristics
Table 3 Univariate and Multivariate Analysis of Risk Factors for the Two Groups
Table 4 Diagnostic Evaluation Index of the T1D and T2HS
Table 5 Critical Value of TOAST and IDA
Table 6 The Score Value of Each Indicator
Table 7 Distribution of Each Score
Table 8 Critical Value of Total Score
Table 9 The Score of Each Index of the Test Group
Table 10 Diagnostic Evaluation Index of the Scoring System
Figure 5 Receiver operating characteristic curve.
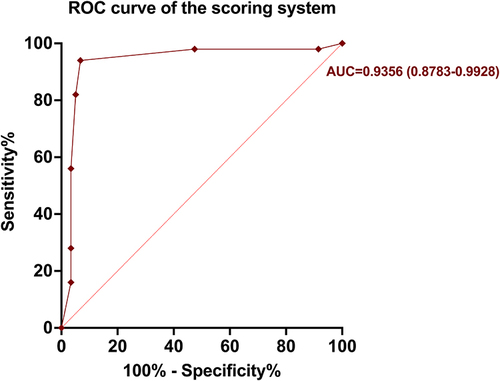
Table 11 Scoring System of ALL Injury