
Figures & data
Figure 1 Patient disposition: Among the 5 patients who were not randomized, 3 failed to respond to the allergen challenge on screening and 2 were lost to follow-up. Randomized participants were assigned to one of six possible treatment sequences.
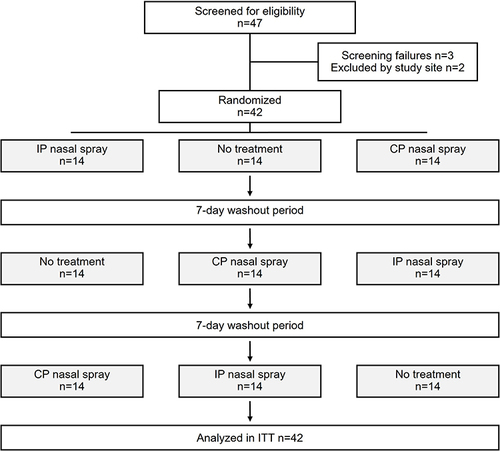
Table 1 Demographic and Clinical Characteristics of the Patients at Baseline (Intention-to-Treat Population)
Figure 2 Average time course of TNSS following allergen exposure for the three treatment periods. Error bars indicate SEM.
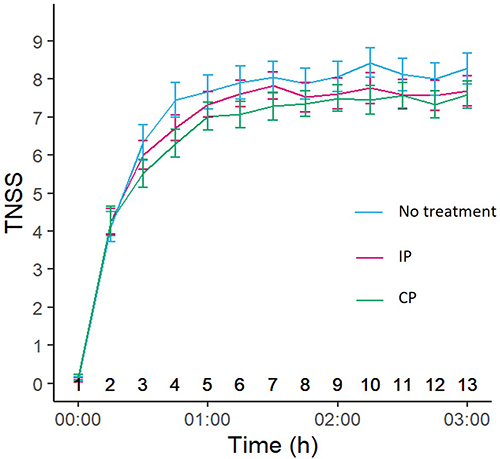
Table 2 Mean TNSS, its Individual Nasal Symptoms, and Nasal Secretion Weight at 3 hr. Difference from “No Treatment” Control is Given as Mean Treatment Difference with Associated 95% CIs and P-values
Table 3 Population Analysis of TNSS Scores
Table 4 Mean Nasal Secretion [G] Ø(0:30–3h) for the Full Analysis Set (FAS)
Table 5 Safety Profile. All Adverse Events Started During a Washout Phase and Were Rated as Non-Related to the Treatment