Figures & data
Figure 1 Case Flow Chart.
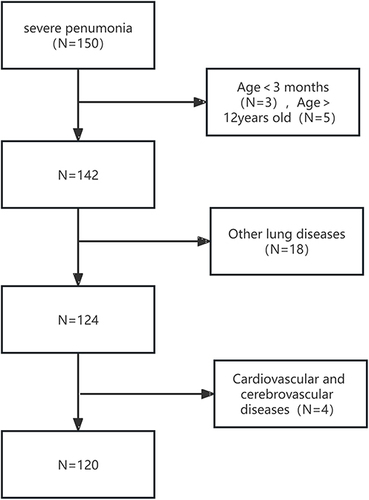
Table 1 Comparison of Serum cTnT and BNP Levels Before and After Treatment Between Two Groups
Table 2 Comparison of Serum cTnT and BNP Levels Between the Two Groups Before and After Treatment
Table 3 Comparison of ECG Changes Before and After Treatment Between the Two Groups [n (%)]
Table 4 Comparison of Serum cTnT and BNP Levels in Patients with Severe Pneumonia with Different Prognosis Before and After Treatment
Table 5 Comparison of ECG Changes in Patients with Severe Pneumonia with Different Prognosis Before and After Treatment [n (%)]
Table 6 Multivariate Logistic Regression Analysis of Prognostic Factors in Children with Pneumonia
Table 7 Prognostic Value of Serum cTnT and BNP Levels in Children with Severe Pneumonia After Treatment
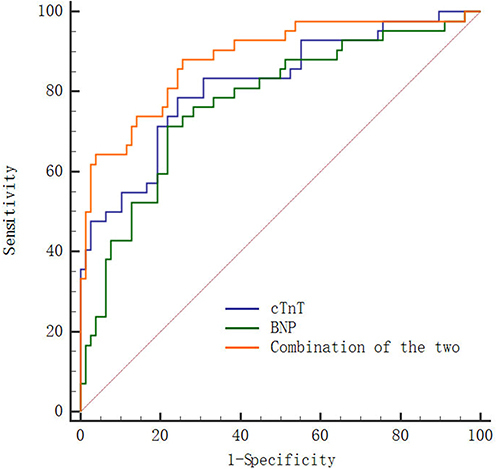
Figure 2 ROC Curves for Predicting the Prognosis of Patients with Severe Pneumonia Using Serum cTnT and BNP Levels After Treatment.